 Back
BackQuantitative Genetics: Polygenic Inheritance, Statistical Analysis, and Heritability
Study Guide - Smart Notes
 Tailored notes based on your materials, expanded with key definitions, examples, and context.
Quantitative Genetics
Polygenic Inheritance and the Nature of Quantitative Characteristics
Quantitative genetics studies traits that are influenced by multiple genes and environmental factors, resulting in continuous variation within populations. These traits, unlike discrete Mendelian traits, show a range of phenotypes.
Discontinuous (discrete) characteristics: Traits with a few distinct phenotypes, such as flower color in peas.
Continuous (quantitative) characteristics: Traits with a wide range of phenotypes, such as height or skin color, often due to polygenic inheritance (multiple gene loci with additive effects).
Multifactorial (complex) characteristics: Traits influenced by both genetic and environmental factors.
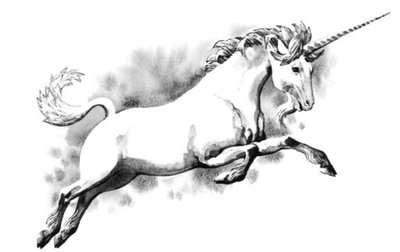
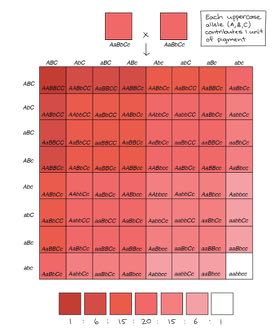
Example: Height in unicorns is determined by two gene loci, each with two alleles. The combination of alleles results in five phenotypic classes, demonstrating the additive effect of polygenes.
Polygene hypothesis: Proposed by Nilsson-Ehle (1909), this hypothesis explains quantitative inheritance as the result of multiple genes, each contributing a small, additive effect to the phenotype.
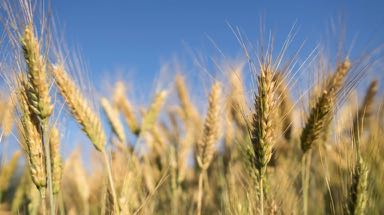
Example: Kernel color in wheat is determined by two or more loci, with each dominant allele contributing to the intensity of red color. The F2 generation shows a range of phenotypes from dark red to white, following a 1:4:6:4:1 ratio for two loci.
Estimating the number of polygenes: The proportion of F2 individuals with the extreme phenotype can be used to estimate the number of loci involved using the formula:
where n is the number of gene loci.
Types of quantitative characteristics:
Continuous characteristics: Can assume any value within limits (e.g., height).
Meristic characteristics: Measured in whole numbers (e.g., number of seeds).
Threshold characteristics: Expressed only when a certain threshold of causal factors is reached (e.g., disease susceptibility).
Statistical Methods for Analysis of Quantitative Traits
Statistical tools are essential for describing and analyzing quantitative traits in populations.
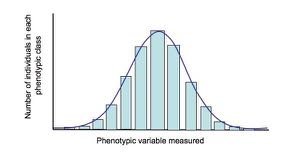
Phenotypic variance in a population can be described by a frequency distribution, showing the number of individuals in each phenotypic class.
Sample mean (average): Estimates the center of the distribution.
Variance (s2): Measures the spread of the distribution.
Standard deviation (s): The square root of variance.
Example: Inheritance of flower length in a cross between short and long-flowered plants produces F1 and F2 generations with intermediate and variable lengths, respectively.
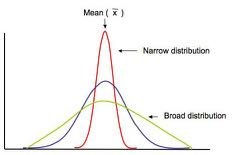
Observation: F2 generations typically show greater variance than F1, indicating genetic contribution to phenotypic variance.
Components of Phenotypic Variance
Phenotypic variance (VP) can be partitioned into genetic (VG) and environmental (VE) components:
Genetic variance (VG): Variation due to genetic differences.
Environmental variance (VE): Variation due to environmental factors.
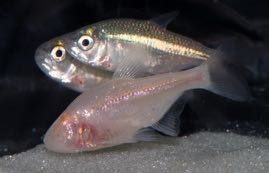
Example: Variation in eye diameter in Astyanax fish. F1 (genetically uniform) variance estimates VE, while F2 (genetically heterogeneous) variance estimates VG + VE. Subtracting gives VG.
Heritability Measures
Heritability quantifies the proportion of phenotypic variance attributable to genetic factors.
Broad-sense Heritability (H2)
Broad-sense heritability measures the total genetic contribution to phenotypic variance:
Ranges from 0 (no genetic contribution) to 1 (all variance genetic).
Includes additive, dominance, and epistatic genetic effects.
Example: For eye diameter in Astyanax, H2 = 0.899, indicating high genetic influence.
Characteristic | Heritability, H2 |
|---|---|
Height | 0.85 |
Weight | 0.63 |
Memory | 0.47 |
Longevity | 0.29 |
Narrow-sense Heritability (h2)
Narrow-sense heritability measures the proportion of phenotypic variance due to additive genetic effects:
Important for predicting offspring phenotype from parental phenotype.
Ranges from 0 to 1.
Trait | Heritability, h2 |
|---|---|
Human stature | 0.65 |
Litter size in pigs | 0.05 |
Selection response (R): The amount that selection can influence phenotype.
Selection differential (s): The difference between the mean of selected parents and the original population mean.
Breeder’s equation:
Example: Selection for increased corolla tube length in tobacco:
Original mean = 70 mm
Selected mean = 81 mm
F1 mean = 77 mm
h2 = 0.64
Quantitative Trait Loci (QTLs)
QTLs are regions of DNA associated with variation in a quantitative trait. They can be mapped using genetic markers to identify the genetic basis of complex traits.
QTL mapping involves associating DNA markers with phenotypic variation.
The effect size of a QTL can be quantified as the percentage of phenotypic variance it explains.
Example: QTLs underlying floral pollination syndrome divergence in Penstemon species have been identified using marker-trait associations.
Additional info: QTL mapping is a powerful tool in plant and animal breeding, as well as in evolutionary biology, for dissecting the genetic architecture of complex traits.
