 Back
BackQuantitative Traits, Variance, Heritability, and QTL Mapping
Study Guide - Smart Notes
 Tailored notes based on your materials, expanded with key definitions, examples, and context.
Quantitative Traits
Introduction to Quantitative Traits
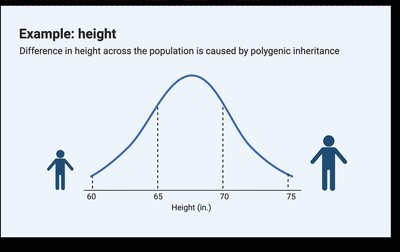
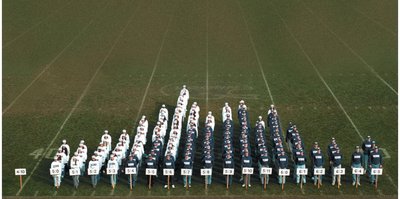
Quantitative traits are phenotypes that show continuous variation within a population, rather than falling into discrete categories. These traits are typically influenced by multiple genes (polygenic inheritance) and environmental factors, resulting in a bell-shaped, normal distribution of phenotypes.
Polygenic traits: Traits controlled by two or more genes, each contributing additively to the phenotype.
Environmental effects: Environmental factors can also influence the expression of quantitative traits.
Examples: Height, skin color, and weight in humans.
Categorical vs. Continuous Traits
Traits can be classified based on their phenotypic distribution:
Categorical traits: Phenotypes fall into distinct classes (e.g., blood type).
Continuous traits: Phenotypes show a range of values, often forming a normal distribution.
Meristic traits: Traits measured in discrete numbers (e.g., number of seeds).
Polygenic Model for Quantitative Traits
In the polygenic model, each gene (polygene) contributes additively to the phenotype. The combined effect of multiple genes results in a continuous range of phenotypes.
Quantitative trait locus (QTL): A chromosomal region containing one or more genes that contribute to variation in a quantitative trait.
Major Genes and Modifier Genes
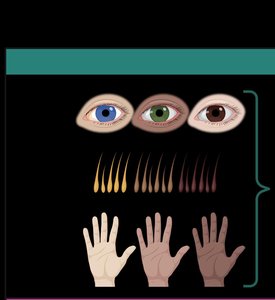
Some quantitative traits are influenced by major genes with large effects, while others are modified by additional genes with smaller effects.
Major gene example: HERC2/OCA2 locus affecting eye color.
Modifier genes: Genes such as TYR, TYRP1, DCT, SLC45A2, ASIP, SILV, MYO5A, IRF4, SLC24A4 can modify pigmentation traits.
Additive Gene Effects
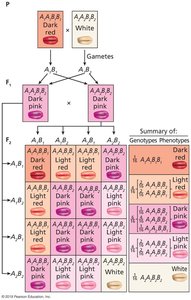
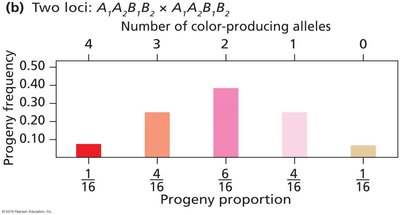
When multiple loci contribute additively to a trait, the phenotype is determined by the sum of the effects of all alleles present.
Additive effect: Each allele contributes a fixed amount to the phenotype, and the total phenotype is the sum of these contributions.
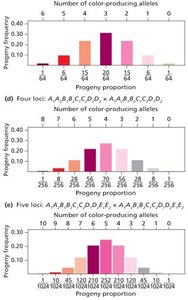
Phenotypic categories: The number of phenotypic categories for n genes is given by 2n + 1.
Phenotypic Distribution of Additive Genes
The distribution of phenotypes in a population with additive gene effects forms a normal (bell-shaped) curve. The more genes involved, the smoother and more continuous the distribution.
Allelic Series and Continuous Variation
Continuous variation can also result from allelic series, where multiple alleles at a single locus contribute different amounts to the phenotype.
Gene-Environment Interactions
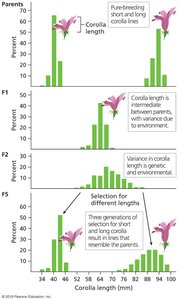
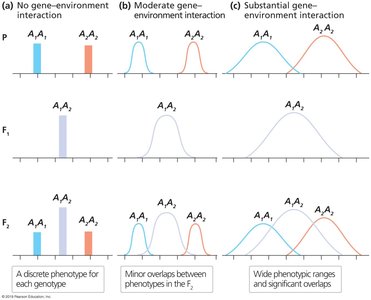
Phenotypic variation in quantitative traits can be influenced by gene-gene interactions, environmental factors, and gene-environment interactions. Understanding the source of variation is important in fields such as agriculture and evolutionary biology.
Threshold Traits
Some quantitative traits are expressed only when a certain threshold of genetic liability is exceeded. These are called threshold traits and are often seen in disease susceptibility.
Variance and Heritability
Measuring Continuous Traits in Populations
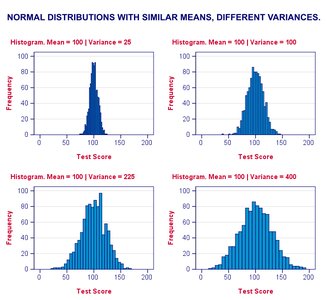
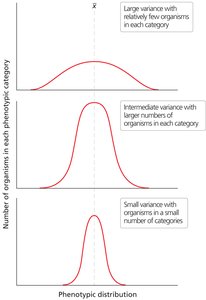
Quantitative traits in populations are described using statistical measures such as mean and variance.
Mean (\( \bar{x} \)): The average value of the trait in the population.
Variance (\( s^2 \)): A measure of the spread of trait values around the mean.
Calculating Mean and Variance
Mean:
Variance (Population):
Variance (Sample):
Partitioning Phenotypic Variance
Phenotypic variance (\( V_P \)) can be partitioned into genetic variance (\( V_G \)) and environmental variance (\( V_E \)):
Genetic and environmental contributions can be estimated using controlled crosses and statistical analysis.
Heritability
Heritability measures the proportion of phenotypic variance that is attributable to genetic variance.
Broad-sense heritability (H2):
Narrow-sense heritability (h2): , where is the additive genetic variance.
Genetic variance components: (additive, dominance, and interaction variance)
Twin Studies and Heritability
Twin studies are used to estimate heritability by comparing phenotypic similarity between monozygotic (MZ) and dizygotic (DZ) twins.
Falconer's formula:
MZ twins share all genes; DZ twins share half, on average.
Heritability and Selection
Heritability is important for predicting the response of a population to selection. The breeder's equation relates the response to selection (R) to heritability and the selection differential (S):
Breeder's equation:
Selection differential (S): Difference between the mean of selected parents and the population mean.
Response to selection (R): Difference between the mean of offspring and the original population mean.
QTL Mapping
Introduction to QTL Mapping
Quantitative Trait Locus (QTL) mapping is a method used to identify the genetic basis of quantitative traits. It involves crossing individuals with distinct phenotypes and tracking the segregation of molecular markers (e.g., SNPs) that co-segregate with the trait of interest.
Controlled crosses are used to generate mapping populations.
Recombination and linkage analysis help localize QTLs.
Large sample sizes and many markers are required for high-resolution mapping.
QTL Mapping with Linkage
Linkage analysis is used to determine the genetic distance between QTLs and molecular markers. Markers that show low recombination with the trait locus are likely to be physically close to the QTL.
F1 intercrosses produce F2 mapping populations for analysis.
Map distance (in centimorgans, cM) is calculated based on recombinant frequencies.
Applications and Example Problems
QTL mapping is widely used in agriculture, evolutionary biology, and medicine to identify genes underlying complex traits and diseases. Example problems often involve calculating the number of phenotypic classes, frequencies, and interpreting mapping results.
Summary Table: Key Concepts in Quantitative Genetics
Concept | Definition | Formula |
|---|---|---|
Phenotypic Variance (VP) | Total variance in a trait | |
Genetic Variance (VG) | Variance due to genetic differences | |
Environmental Variance (VE) | Variance due to environmental factors | - |
Broad-sense Heritability (H2) | Proportion of VP due to VG | |
Narrow-sense Heritability (h2) | Proportion of VP due to VA | |
Breeder's Equation | Predicts response to selection |
Additional info: These notes integrate foundational concepts from population and quantitative genetics, including the statistical treatment of phenotypic variation, the genetic architecture of complex traits, and the practical application of QTL mapping in research and breeding programs.
