 Back
BackStep-by-Step Guidance for Genetics Exam Review: Gene Expression, Regulation, and Genomics
Study Guide - Smart Notes
 Tailored notes based on your materials, expanded with key definitions, examples, and context.
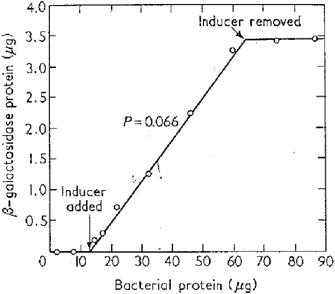
Q12. In the chart below (from Jacob et al. 1961), data is shown for measurements of the ß-galactosidase protein and total bacterial proteins in a bacterial cell culture.
a. What is the probable inducer added to the cell culture?
b. What impact does the inducer have on ß-galactosidase production?
c. What is the inducer doing at the molecular level to have this effect?
d. Why do you think total bacterial protein also increases throughout this experiment?
Background
Topic: Regulation of the lac operon in bacteria
This question tests your understanding of how inducers affect gene expression, specifically the lac operon system in E. coli. The chart shows the relationship between the addition/removal of an inducer and the production of ß-galactosidase, a key enzyme in lactose metabolism.
Key Terms and Concepts:
Inducer: A molecule that initiates gene expression by interacting with a regulatory protein.
ß-galactosidase: An enzyme encoded by the lacZ gene, responsible for breaking down lactose.
Lac operon: A set of genes in E. coli regulated by the presence or absence of lactose and glucose.
Repressor: A protein that binds to the operator region to block transcription.
Inducer-repressor interaction: The inducer binds to the repressor, causing it to release from the operator.
Key formula:
No mathematical formula is required for this conceptual question, but understanding the regulatory mechanism is essential.
Step-by-Step Guidance
Examine the chart: Notice the sharp increase in ß-galactosidase protein after the inducer is added, and the plateau after the inducer is removed. This suggests a direct regulatory effect.
Recall the lac operon mechanism: The lac operon is induced by lactose or its analogs (such as IPTG), which bind to the lac repressor and prevent it from blocking transcription.
Consider the molecular interaction: The inducer binds allosterically to the repressor, causing a conformational change that releases the repressor from the operator region, allowing RNA polymerase to transcribe the lac genes.
Think about the effect on total bacterial protein: As the cells grow and divide, overall protein content increases, but the specific increase in ß-galactosidase is due to induction.
Try solving on your own before revealing the answer!
Final Answer:
a. The probable inducer is lactose or IPTG.
b. The inducer causes a rapid increase in ß-galactosidase production.
c. The inducer binds to the lac repressor, causing it to release from the operator and allowing transcription of the lac operon.
d. Total bacterial protein increases due to cell growth and division, not just induction of ß-galactosidase.
This experiment demonstrates classic inducible gene expression in bacteria, where the presence of an inducer triggers production of a specific enzyme.
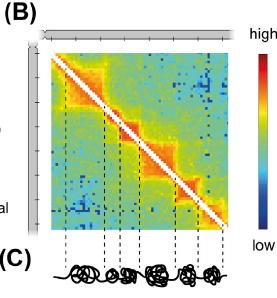
Q13. Below is a heatmap of intra-chromosomal spatial interactions. What is the significance of this chart, and what do the ‘hot’ squares along the diagonal axis represent? What is the role of formaldehyde in generating this data?
Background
Topic: Chromatin structure and spatial genome organization
This question tests your understanding of chromatin interactions and the methods used to study them, such as Hi-C or 3C techniques.
Key Terms and Concepts:
Chromatin: The complex of DNA and proteins that forms chromosomes.
Spatial interactions: Physical contacts between different regions of the genome.
Heatmap: A graphical representation of data where values are depicted by color.
Formaldehyde: A cross-linking agent used to fix chromatin interactions for analysis.
Key formula:
No mathematical formula is required, but understanding the experimental setup is important.
Step-by-Step Guidance
Interpret the heatmap: The diagonal 'hot' squares indicate regions of the chromosome that interact frequently with themselves or nearby regions, suggesting topologically associating domains (TADs).
Understand the significance: These interactions are important for gene regulation, as they bring enhancers, promoters, and other regulatory elements into proximity.
Role of formaldehyde: It is used to cross-link DNA and proteins, preserving the spatial interactions so they can be analyzed after fragmentation and sequencing.
Try solving on your own before revealing the answer!
Final Answer:
The heatmap shows spatial interactions within a chromosome, with 'hot' squares representing regions of high interaction (TADs).
Formaldehyde is used to cross-link chromatin, preserving these interactions for analysis.
This technique helps researchers understand the 3D organization of the genome and its impact on gene regulation.
Q25. The figure below shows synteny between the human and chimpanzee genome along a segment of chromosome 2 (from Kronenberg et al. 2018). What does the hourglass-shaped part of this figure represent?
Background
Topic: Comparative genomics and synteny
This question tests your understanding of synteny, which refers to the conservation of blocks of genes between species, and how structural variation can be visualized.
Key Terms and Concepts:
Synteny: The conservation of gene order between chromosomes of different species.
Structural variation: Differences in chromosome structure, such as inversions, duplications, or deletions.
Hourglass shape: Indicates regions where gene order is conserved but flanked by areas of rearrangement.
Key formula:
No mathematical formula is required, but understanding the visual representation is key.
Step-by-Step Guidance
Examine the synteny map: The hourglass shape is formed by lines connecting conserved regions between human and chimpanzee chromosomes.
Interpret the hourglass: This shape suggests a region of high conservation surrounded by areas of structural variation, such as inversions or duplications.
Consider the evolutionary significance: These conserved regions may be functionally important, while the flanking regions have undergone rearrangements.
Try solving on your own before revealing the answer!
Final Answer:
The hourglass-shaped region represents a block of conserved synteny between human and chimpanzee chromosome 2, flanked by areas of structural variation.
This visualization highlights evolutionary changes and conserved functional regions between species.
