Ch. 5 - Genetic Linkage and Mapping in Eukaryotes
Sanders - Genetic Analysis: An Integrated Approach 3rd Edition
Sanders3rd EditionGenetic Analysis: An Integrated ApproachISBN: 9780135564172당신이 사용하는 게 아니라요?교과서 변경
5장, 문제 8a

Gene G recombines with gene T at a frequency of 7%, and gene G recombines with gene R at a frequency of 4%.


Draw two possible genetic maps for these three genes, and identify the recombination frequencies predicted for each map.

검증된 단계별 안내
1
Understand that recombination frequency is proportional to the physical distance between genes on a chromosome. A 7% recombination frequency between genes G and T means they are 7 map units apart, and a 4% recombination frequency between genes G and R means they are 4 map units apart.
Consider the possible arrangements of the three genes (G, T, and R) on the chromosome. Since G is the reference point, the two possible arrangements are: (1) G is between T and R, or (2) T and R are on the same side of G.
For the first arrangement (G between T and R), place G in the middle, with T 7 map units away from G and R 4 map units away from G. Calculate the predicted recombination frequency between T and R by summing the distances between T and G and G and R.
For the second arrangement (T and R on the same side of G), place G at one end, with T 7 map units away from G and R 4 map units away from G. Calculate the predicted recombination frequency between T and R by subtracting the smaller distance (4 map units) from the larger distance (7 map units).
Compare the predicted recombination frequencies for T and R in both arrangements. These frequencies will help determine which genetic map is more likely based on experimental data.

비슷한 문제에 대한 검증된 영상 답변:

이 영상 해법은 위 문제에 도움이 된다고 튜터들이 추천한 것입니다.
영상 길이:
1m

주요 개념

질문에 올바르게 답하기 위해 반드시 이해해야 하는 핵심 개념들은 다음과 같습니다.

Recombination Frequency

Recombination frequency is a measure of the likelihood that two genes will be separated during meiosis due to crossing over. It is expressed as a percentage, indicating the proportion of offspring that exhibit a recombinant phenotype. A higher recombination frequency suggests that genes are located further apart on a chromosome, while a lower frequency indicates they are closer together.
추천 영상:
가이드 코스
03:51
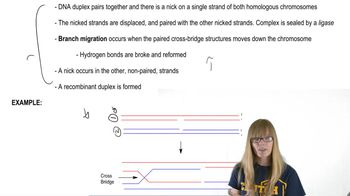
Recombination after Single Strand Breaks

Genetic Mapping

Genetic mapping is the process of determining the relative positions of genes on a chromosome. This is achieved by analyzing recombination frequencies between pairs of genes. By constructing genetic maps, researchers can visualize the arrangement of genes and predict the likelihood of recombination events, which is essential for understanding inheritance patterns.
추천 영상:
가이드 코스
11:11
Mapping Overview

Linkage and Linkage Disequilibrium

Linkage refers to the tendency of genes located close to each other on a chromosome to be inherited together during meiosis. Linkage disequilibrium occurs when the association between alleles at different loci is non-random, often due to physical proximity. Understanding linkage is crucial for interpreting recombination frequencies and constructing accurate genetic maps.
추천 영상:
가이드 코스
07:33
Chi Square and Linkage
관련 실천
교과서 질문

In Drosophila, the map positions of genes are given in map units numbering from one end of a chromosome to the other. The X chromosome of Drosophila is 66 m.u. long. The X-linked gene for body color—with two alleles, y⁺ for gray body and y for yellow body—resides at one end of the chromosome at map position 0.0. A nearby locus for eye color, with alleles w⁺ for red eye and w for white eye, is located at map position 1.5. A third X-linked gene, controlling bristle form, with f⁺ for normal bristles and f for forked bristles, is located at map position 56.7. At each locus the wild-type allele is dominant over the mutant allele.


Explain how each of the predicted progeny classes is produced.

725
views
교과서 질문

Genes A, B, and C are linked on a chromosome and found in the order A–B–C. Genes A and B recombine with a frequency of 8%, and genes B and C recombine at a frequency of 24%. For the cross a⁺b⁺c/abc⁺ × abc/abc, predict the frequency of progeny genotypes. Assume interference is zero.

1179
views
교과서 질문

Genes A, B, C, D, and E are linked on a chromosome and occur in the order given.


Previous genetic linkage crosses have determined that recombination frequencies are 6% for genes A and B, 4% for genes B and C, 10% for genes C and D, and 11% for genes D and E. The sum of these frequencies between genes A and E is 31%. Why does the recombination distance between these genes as determined by adding the intervals between adjacent linked genes differ from the distance determined by the test cross?

1172
views
교과서 질문

Gene G recombines with gene T at a frequency of 7%, and gene G recombines with gene R at a frequency of 4%.


Assuming that organisms with any desired genotype are available, propose a genetic cross whose result could be used to determine which of the proposed genetic maps is correct.

541
views
교과서 질문

In Drosophila, the map positions of genes are given in map units numbering from one end of a chromosome to the other. The X chromosome of Drosophila is 66 m.u. long. The X-linked gene for body color—with two alleles, y⁺ for gray body and y for yellow body—resides at one end of the chromosome at map position 0.0. A nearby locus for eye color, with alleles w⁺ for red eye and w for white eye, is located at map position 1.5. A third X-linked gene, controlling bristle form, with f⁺ for normal bristles and f for forked bristles, is located at map position 56.7. At each locus the wild-type allele is dominant over the mutant allele.


A wild-type female fruit fly with the genotype y⁺w⁺f/ywf⁺ is crossed to a male fruit fly that has yellow body, white eye, and forked bristles. Predict the frequency of each progeny phenotype class produced by this mating.

544
views
교과서 질문

Genes A, B, C, D, and E are linked on a chromosome and occur in the order given.


The test cross Ae/aE x ae/ae  indicates the genes recombine with a frequency of 28%. If 1000 progeny are produced by this test cross, determine the number of progeny in each outcome class.

837
views