Circle Graphs: 동영상 및 연습문제
Circle Graphs show how a whole set of data is divided into categories. The entire circle represents the whole quantity, and each sector or slice represents one category. Larger sectors represent larger parts of the whole, so a circle graph can be used to quickly identify the greatest category, the least category, and compare relative sizes across the data.
To interpret a circle graph, first recognize whether the slices are labeled with values or with percentages. If values are given, the total is found by adding all categories. A category’s percent of the whole is found with partial divided by whole, written as \(\frac{\text{part}}{\text{whole}}\times 100\\%\)
Circle graphs can also be used to compare categories, combine categories, and describe distributions of data. Understanding that the circle is the whole and each sector is a part helps you read totals, identify largest and smallest sectors, and explain what share of the whole each category represents.
Circle Graphs


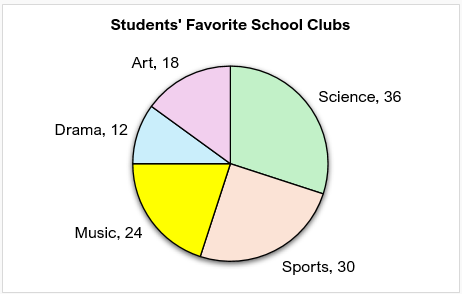
A survey asked 120 students which school club they participate in most often. The results are shown in the following circle graph. Which club has the largest number of students?
Art
Drama
Music
Sports
Science
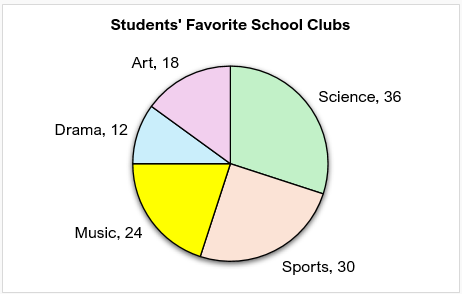
A survey asked 120 students which school club they participate in most often. The results are shown in the following circle graph. Which club has the lowest number of students attending?
Art
Drama
Music
Sports
Science
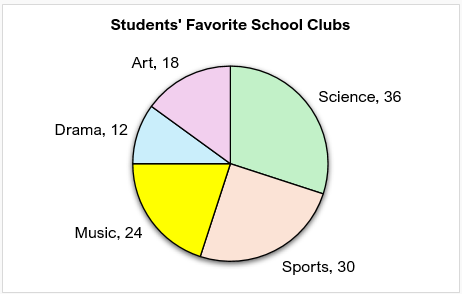
A survey asked 120 students which school club they participate in most often. The results are shown in the following circle graph. How many more students attend Music than Art?
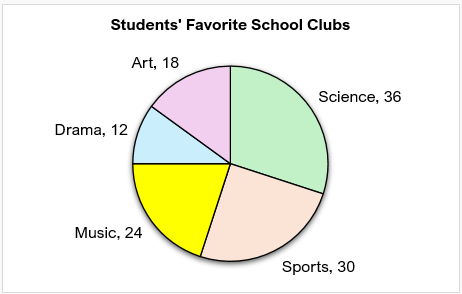
A survey asked 120 students which school club they participate in most often. The results are shown in the following circle graph. What percentage of students are in Sports?
Circle Graphs Example 1