Tables: 동영상 및 연습문제
Tables are a common way to organize data so information is easier to read and compare. A table is made of columns, which list different categories of information, rows, which show all the details for one specific entry, and cells, the individual boxes where a single piece of information appears.
To interpret a table, first identify which column contains the category you need, then locate the matching row and read across to find the related value. Tables can be used to answer questions, compare values, and find specific details such as names, categories, scores, or totals. They can also help organize information from words into a clear structure by placing each item into the correct row and column.
Tables are useful for analyzing organized information, including finding totals within a column and comparing amounts across rows. Understanding how rows, columns, and cells work together makes it easier to read information accurately and construct tables from given data.
Intro To Tables


Based on the table below, which grade level borrowed science textbooks?
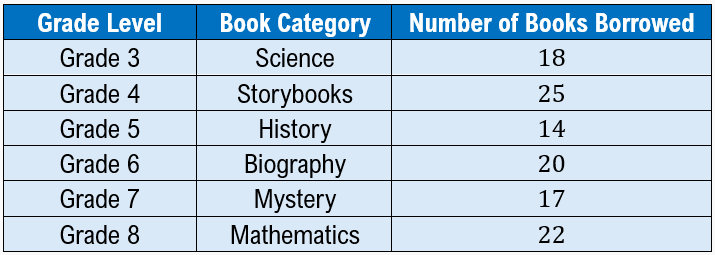
Grade 3
Grade 4
Grade 6
Grade 8
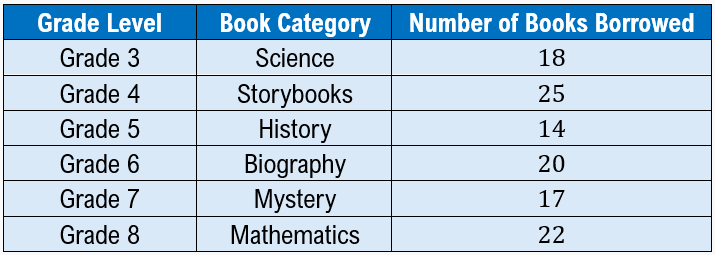
Based on the table below, how many story books were borrowed?
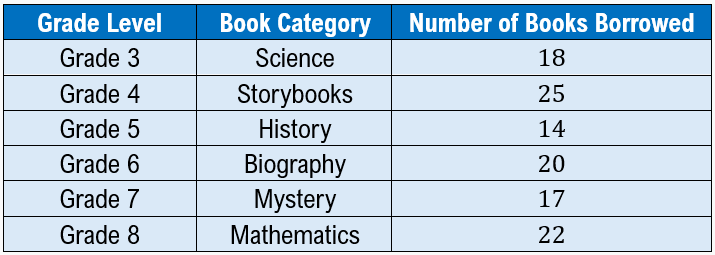
Based on the table below, which book category was borrowed by grade 6?
Storybooks
Mystery
Biography
History
Intro To Tables Example 1
Intro To Tables Example 2