Frequency Distributions and Histograms: 동영상 및 연습문제
Frequency Distributions and Histograms organize data into class intervals and show how often values fall in each range. In a frequency distribution table, the classes are the categories or intervals, tally marks help count values, and the frequency is the number of measurements in each class. When constructing a table, class intervals should be evenly spaced and should not overlap, so each data value belongs to only one interval.
A histogram is a bar graph based on a frequency distribution, with touching bars. The horizontal axis shows the class intervals, and the vertical axis shows frequency. To build a histogram, use each row of the frequency distribution table and draw a bar whose height matches the frequency for that interval. Histograms make it easier to interpret grouped data, identify the most common range by the tallest bar, and find less common ranges by the shortest bars.
Frequency Distributions


Frequency Distributions Example 1
Frequency Distributions Example 2
Frequency Distributions Example 3
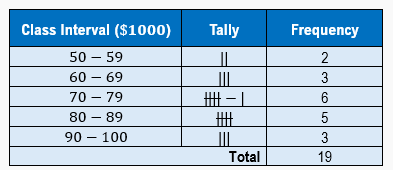
The frequency distribution table below lists the salary of various workers in the Chicago area. How many individuals are making 80k or more annually?
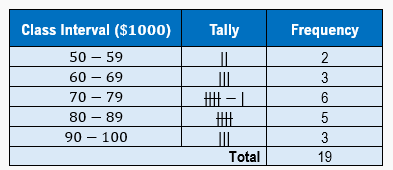
The frequency distribution table below lists the salary of various workers in the Chicago area. What is the most common average salary range in the area?
\$50,000 - \$59,000
\$60,000 - \$69,000
\$80,000 - \$89,000
\$70,000 - \$79,000
Histograms
Histograms Example 4
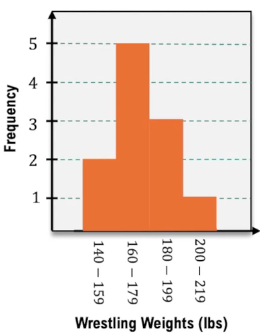
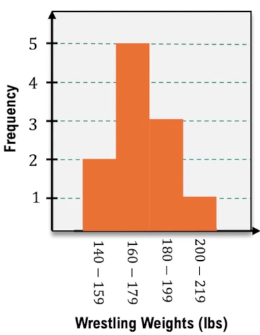
The weights of a group of college wrestlers were recorded based on the histogram below: Estimate how many athletes are between 180 and 199 pounds.
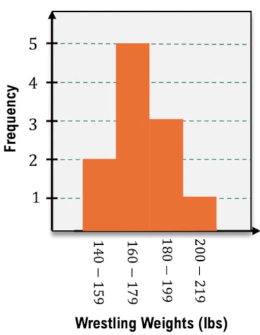
The weights of a group of college wrestlers were recorded based on the histogram below: What is the most common weight range amongst athletes?
lbs
lbs
lbs
lbs
The weights of a group of college wrestlers were recorded based on the histogram below: Estimate how many athletes are under 200 pounds.