Skip to main content
Organic Chemistry
My Course
Learn
Exam Prep
AI Tutor
Study Guides
Textbook Solutions
Flashcards
Explore
Try the app
My Course
Learn
Exam Prep
AI Tutor
Study Guides
Textbook Solutions
Flashcards
Explore
Try the app
Back
Energy Diagram definitions
You can tap to flip the card.
Free Energy Diagram
You can tap to flip the card.
👆
Free Energy Diagram
A graphical summary showing energy changes during a reaction, highlighting both spontaneity and reaction rate.
Track progress
Control buttons has been changed to "navigation" mode.
1/15
Related flashcards
Related practice
Recommended videos
Energy Diagram quiz
Energy Diagram
15 Terms
Energy Diagram
6. Thermodynamics and Kinetics
7 problems
Topic
Johnny
Gibbs Free Energy
6. Thermodynamics and Kinetics
7 problems
Topic
Johnny
6. Thermodynamics and Kinetics - Part 1 of 2
4 topics
11 problems
Chapter
Ernest
6. Thermodynamics and Kinetics - Part 2 of 2
4 topics
10 problems
Chapter
Johnny
Guided course
08:30
Introduction to free energy diagrams.
4769
views
40
rank
3
comments
Guided course
01:14
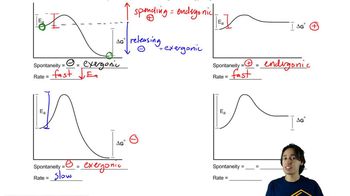
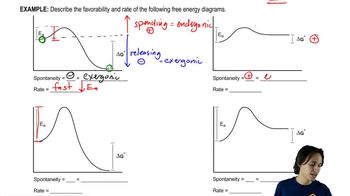
Favorability and rate of Free Energy Diagrams
2877
views
16
rank
4
comments
Guided course
00:34
Favorability and rate of Free Energy Diagrams
3103
views
19
rank
1
comments
Terms in this set (15)
Hide definitions
Free Energy Diagram
A graphical summary showing energy changes during a reaction, highlighting both spontaneity and reaction rate.
Thermodynamics
The study of energy changes and favorability in chemical reactions, often linked to spontaneity.
Kinetics
The aspect of reactions focused on how quickly a process occurs, independent of its favorability.
Molecular Orbital Diagram
A visual tool displaying energy levels of atomic and molecular orbitals before and after bonding.
Activation Energy
The energy gap between reactants and the highest energy point, determining the minimum input for a reaction to proceed.
Reaction Coordinate
The X-axis on an energy diagram, representing the progression from reactants to products.
Gibbs Free Energy
A thermodynamic quantity combining enthalpy and entropy to predict reaction spontaneity.
Enthalpy
A measure of heat content in a system, influencing the energy change during reactions.
Entropy
A measure of disorder or randomness, affecting the spontaneity of chemical processes.
Spontaneity
A property indicating whether a reaction proceeds on its own under given conditions.
Bond Formation
A process where atoms share electrons, resulting in a lower energy state and increased stability.
Energy Level
A specific value representing the potential or stored energy of atoms or molecules in a system.
Octet
A stable electron configuration achieved when atoms have eight electrons in their valence shell.
1s Orbital
The lowest energy atomic orbital, occupied by hydrogen's single electron before bonding.
Angstrom
A unit of length (10^-10 meters) used to describe atomic-scale distances, such as optimal bond lengths.
 BackBack


 08:30
08:30