The table below shows the results from a drug trial for a new ADHD medication. Use the table to find the probability that a person's symptoms improved and identify the type of probability found.
Table of contents
- 1. Intro to Stats and Collecting Data1h 14m
- 2. Describing Data with Tables and Graphs1h 55m
- 3. Describing Data Numerically2h 5m
- 4. Probability2h 16m
- 5. Binomial Distribution & Discrete Random Variables3h 6m
- 6. Normal Distribution and Continuous Random Variables2h 11m
- 7. Sampling Distributions & Confidence Intervals: Mean3h 23m
- Sampling Distribution of the Sample Mean and Central Limit Theorem19m
- Distribution of Sample Mean - Excel23m
- Introduction to Confidence Intervals15m
- Confidence Intervals for Population Mean1h 18m
- Determining the Minimum Sample Size Required12m
- Finding Probabilities and T Critical Values - Excel28m
- Confidence Intervals for Population Means - Excel25m
- 8. Sampling Distributions & Confidence Intervals: Proportion1h 25m
- 9. Hypothesis Testing for One Sample3h 29m
- 10. Hypothesis Testing for Two Samples4h 50m
- Two Proportions1h 13m
- Two Proportions Hypothesis Test - Excel28m
- Two Means - Unknown, Unequal Variance1h 3m
- Two Means - Unknown Variances Hypothesis Test - Excel12m
- Two Means - Unknown, Equal Variance15m
- Two Means - Unknown, Equal Variances Hypothesis Test - Excel9m
- Two Means - Known Variance12m
- Two Means - Sigma Known Hypothesis Test - Excel21m
- Two Means - Matched Pairs (Dependent Samples)42m
- Matched Pairs Hypothesis Test - Excel12m
- 11. Correlation1h 24m
- 12. Regression1h 50m
- 13. Chi-Square Tests & Goodness of Fit2h 21m
- 14. ANOVA1h 57m
4. Probability
Introduction to Contingency Tables
Problem 3.R.18
Textbook Question
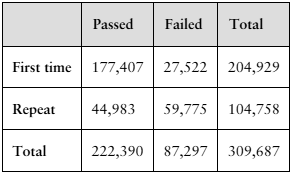
"In Exercises 17 and 18, use the table, which shows the numbers of first-time and repeat U.S. nursing students taking the National Council Licensure Examination (NCLEX-RN® exam) to pass or fail in a recent year. (Adapted from National Council Licensure Examinations)

18. Find the probability that a student passed, given that the student repeated the exam."
Verified step by step guidance1
Step 1: Understand the problem. We are tasked with finding the probability that a student passed the NCLEX-RN exam, given that the student repeated the exam. This is a conditional probability problem, where we need to focus on the 'Repeat' row of the table.
Step 2: Recall the formula for conditional probability. The probability of event A given event B is calculated as P(A|B) = P(A ∩ B) / P(B). In this case, A is 'Passed' and B is 'Repeated the exam'.
Step 3: Identify the relevant values from the table. From the 'Repeat' row, the number of students who passed is 44,983, and the total number of students who repeated the exam is 104,758.
Step 4: Apply the formula. The conditional probability P(Passed | Repeated) is calculated as the number of students who passed and repeated (44,983) divided by the total number of students who repeated the exam (104,758).
Step 5: Simplify the fraction or calculate the division to find the probability. This step involves performing the division 44,983 / 104,758 to get the final probability value.
Verified video answer for a similar problem:This video solution was recommended by our tutors as helpful for the problem above
Video duration:
3mPlay a video:
Was this helpful?
Key Concepts
Here are the essential concepts you must grasp in order to answer the question correctly.
Conditional Probability
Conditional probability refers to the likelihood of an event occurring given that another event has already occurred. In this context, it involves calculating the probability that a nursing student passed the NCLEX-RN exam, given that they are a repeat test-taker. This is expressed mathematically as P(Pass | Repeat), which requires using the number of repeat students who passed divided by the total number of repeat students.
Recommended video:
Conditional Probability Rule
Total Probability
Total probability is a fundamental concept in probability theory that helps in calculating the overall likelihood of an event by considering all possible scenarios. In this case, it involves understanding the total number of students who took the exam, both first-time and repeat test-takers, to contextualize the passing rates. This concept is essential for determining the base rates needed for calculating conditional probabilities.
Recommended video:
Introduction to Probability
Data Interpretation
Data interpretation involves analyzing and making sense of numerical data presented in tables or charts. In this question, it requires extracting relevant figures from the provided table, such as the number of repeat students who passed and the total number of repeat students, to compute the desired probability. Effective data interpretation is crucial for accurately answering statistical questions and drawing valid conclusions.
Recommended video:
Introduction to Collecting Data
Watch next
Master Introduction to Contingency Tables with a bite sized video explanation from Patrick
Start learningRelated Videos
Related Practice
Multiple Choice
148
views
5
rank
