

Ch. 2 - Descriptive Statistics
Larson - Elementary Statistics: Picturing the World 8th Edition
Larson8th EditionElementary Statistics: Picturing the WorldISBN: 9780137493470Not the one you use?Change textbook
Chapter 2, Problem 2.1.16

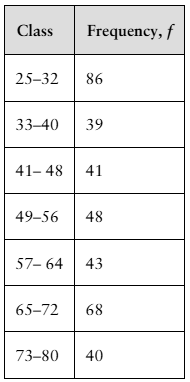
use the frequency distribution to find the (a) class width, (b) class midpoints, and (c) class boundaries.
Toledo, OH, Average Normal Temperatures (F)
Table displaying frequency distribution of average normal temperatures in Toledo, OH, with class intervals and corresponding frequencies.

Verified step by step guidance
1
Step 1: To find the class width, subtract the lower boundary of the first class from the upper boundary of the first class. For example, for the class 25–32, the class width is calculated as 32 - 25.
Step 2: To find the class midpoints, calculate the average of the lower and upper boundaries for each class. For example, for the class 25–32, the midpoint is calculated as (25 + 32) / 2.
Step 3: To find the class boundaries, subtract 0.5 from the lower boundary and add 0.5 to the upper boundary for each class. For example, for the class 25–32, the boundaries are calculated as 24.5 and 32.5.
Step 4: Repeat the calculations for class width, midpoints, and boundaries for all other classes in the frequency distribution table.
Step 5: Organize the results into a table format for clarity, listing the class widths, midpoints, and boundaries for each class.

Verified video answer for a similar problem:

This video solution was recommended by our tutors as helpful for the problem above.
Video duration:
4m
Was this helpful?

Key Concepts

Here are the essential concepts you must grasp in order to answer the question correctly.

Class Width

Class width is the difference between the upper and lower boundaries of a class interval in a frequency distribution. It helps in determining how data is grouped into intervals. For example, in the class interval 25-32, the class width is 32 - 25 = 7. Consistent class widths are essential for accurate data representation and analysis.
Recommended video:
Guided course
05:18
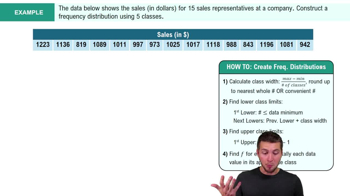
How to Create Frequency Distributions Example 2

Class Midpoint

The class midpoint is the value that lies in the middle of a class interval and is calculated by averaging the upper and lower boundaries of the class. For instance, for the class 25-32, the midpoint is (25 + 32) / 2 = 28.5. Midpoints are useful for summarizing data and performing further statistical calculations, such as finding the mean.
Recommended video:
04:15
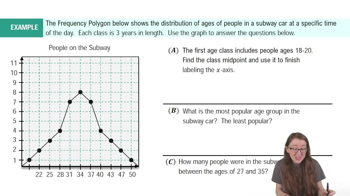
Frequency Polygons Example 1

Class Boundaries

Class boundaries are the values that separate one class interval from another, ensuring there are no gaps between classes. They are typically calculated by taking the average of the upper limit of one class and the lower limit of the next. For example, the boundary between the classes 32 and 33 would be 32.5. Understanding class boundaries is crucial for accurate data analysis and representation.
Recommended video:
Guided course
07:10
How to Create Histogram - TI-84 Calculator
Related Practice
Textbook Question

Finding Sample Statistics In Exercises 15 and 16, find the range, mean, variance, and standard deviation of the sample data set.


Pregnancy Durations The durations (in days) of pregnancies for a random sample of pregnant people

277 291 295 280 268 278 291

277 282 279 296 285 269 293

267 281 286 269 264 299 275

108
views
Textbook Question

use the frequency polygon to identify the class with the greatest, and the class with the least, frequency.

88
views
Textbook Question

Modified Box-and-Whisker Plot In Exercises 59–62, (a) identify any outliers and (b) draw a modified box-and-whisker plot that represents the data set. Use asterisks (*) to identify outliers.


75 78 80 75 62 72 74 75 80 95 76 72

137
views
Textbook Question

Extending Concepts


A Misleading Graph? A misleading graph is not drawn appropriately, which can misrepresent data and lead to false conclusions. In Exercises 37–40, (a) explain why the graph is misleading, and (b) redraw the graph so that it is not misleading.

255
views
Textbook Question

Using and Interpreting Concepts


Finding the Range of a Data Set In Exercises 9 and 10, find the range of the data set represented by the graph.


119
views
Textbook Question

Finding the Sample Mean and Standard Deviation for Grouped Data In Exercises 39 and 40, make a frequency distribution for the data. Then use the table to find the sample mean and the sample standard deviation of the data set.


3 3 5 3 8 0 3 9 6 6 7 1 6 3 2 6 9 1 8 5 0 2 3 4 9

5 8 1 9 7 6 9 6 7 0 6 3 8 6 8 7 3 8 9 3 7 2 4 4 1

279
views