Skip to main content
Statistics
My Course
Learn
Exam Prep
AI Tutor
Study Guides
Textbook Solutions
Flashcards
Explore
Try the app
My Course
Learn
Exam Prep
AI Tutor
Study Guides
Textbook Solutions
Flashcards
Explore
Try the app
Back
Performing Hypothesis Tests: Means definitions
You can tap to flip the card.
Null Hypothesis
You can tap to flip the card.
👆
Null Hypothesis
Default assumption about a population parameter, typically stating equality with a specific value.
Track progress
Control buttons has been changed to "navigation" mode.
1/15
Related flashcards
Related practice
Recommended videos
Performing Hypothesis Tests: Means quiz #1
Performing Hypothesis Tests: Means
10 Terms
9. Hypothesis Testing for One Sample
1 topic
3 problems
Chapter
David-Paige
Guided course
05:55
Standard Deviation (σ) Unknown Example 3
472
views
10
rank
1
comments
Guided course
06:38
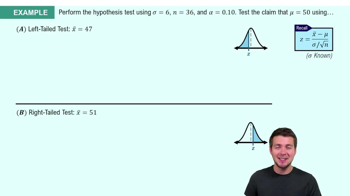
Standard Deviation (σ) Known Example 1
846
views
18
rank
1
comments
Guided course
06:34
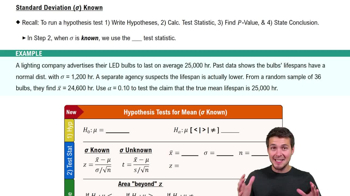
Standard Deviation (σ) Known
1286
views
20
rank
1
comments
Terms in this set (15)
Hide definitions
Null Hypothesis
Default assumption about a population parameter, typically stating equality with a specific value.
Alternative Hypothesis
Contrasting claim to the default, often suggesting a difference or inequality in the population parameter.
Population Mean
Average value for all members of a group, represented by the Greek letter mu.
Population Standard Deviation
Measure of spread for all values in a population, denoted by the Greek letter sigma.
Sample Mean
Average value calculated from a subset of the population, often denoted as x bar.
Sample Standard Deviation
Measure of spread within a sample, represented by the letter s.
Z-Test
Statistical test used when the population standard deviation is known, based on the normal distribution.
T-Test
Statistical test applied when the population standard deviation is unknown, relying on the t distribution.
Test Statistic
Numerical value summarizing sample data for comparison against a theoretical distribution.
P-Value
Probability of observing a result as extreme as the sample, assuming the null hypothesis is true.
Significance Level
Threshold probability, denoted by alpha, used to decide whether to reject the null hypothesis.
Degrees of Freedom
Value calculated as sample size minus one, crucial for determining the shape of the t distribution.
Normal Distribution
Bell-shaped curve describing the spread of values in many populations, used in z-tests.
Random Sample
Subset of a population selected so each member has an equal chance of inclusion.
Left-Tailed Test
Hypothesis test where the alternative hypothesis claims the parameter is less than a specified value.
 BackBack
 05:55
05:55