Skip to main content
Introductory Statistics
My Course
Learn
Exam Prep
AI Tutor
Study Guides
Textbook Solutions
Flashcards
Explore
Try the app
My Course
Learn
Exam Prep
AI Tutor
Study Guides
Textbook Solutions
Flashcards
Explore
Try the app
Back
Uniform Distribution definitions
You can tap to flip the card.
Continuous Random Variable
You can tap to flip the card.
👆
Continuous Random Variable
Can take any value within a range, represented by a probability density function, with infinitely many possible values.
Track progress
Control buttons has been changed to "navigation" mode.
1/15
Related flashcards
Related practice
Recommended videos
Uniform Distribution quiz
Uniform Distribution
15 Terms
Uniform Distribution
6. Normal Distribution and Continuous Random Variables
5 problems
Topic
Ernest
Standard Normal Distribution
6. Normal Distribution and Continuous Random Variables
7 problems
Topic
Laura
6. Normal Distribution and Continuous Random Variables
4 topics
12 problems
Chapter
Justin
Guided course
06:06
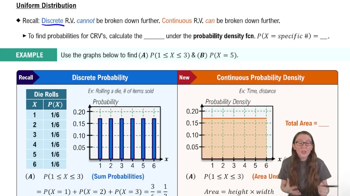
Uniform Distribution
3483
views
17
rank
4
comments
Guided course
02:50
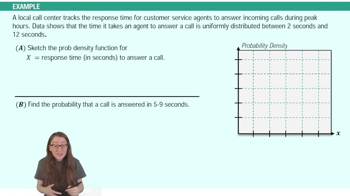
Uniform Distribution Example 1
1453
views
39
rank
1
comments
Terms in this set (15)
Hide definitions
Continuous Random Variable
Can take any value within a range, represented by a probability density function, with infinitely many possible values.
Discrete Random Variable
Has a set of distinct values, often shown in a table or bar graph, with gaps between possible values.
Probability Density Function
Describes how probability is distributed over a range of values for a continuous random variable.
Uniform Distribution
A distribution where every value within a specified range has the same probability density.
Probability
Represents the likelihood of an event, calculated as area under the curve for continuous variables.
Area Under the Curve
Corresponds to the probability for a continuous random variable within a given interval.
Range
The interval of possible values a random variable can assume, such as between zero and six.
Height
The value of the probability density function at a specific point, constant in uniform distributions.
Width
The length of the interval over which probability is calculated for continuous random variables.
Total Probability
The sum of probabilities for all possible outcomes, always equal to one for any probability distribution.
Rectangle
The shape formed under the probability density function in uniform distributions, used to calculate area.
Interval
A segment of the range, such as between one and three, used to determine probability for continuous variables.
Infinite Possibilities
Characteristic of continuous random variables, where there are uncountably many values within any range.
Graph
Visual representation of probability distributions, with bars for discrete and shaded regions for continuous variables.
Table
Organizes possible values and their probabilities for discrete random variables.
 BackBack

 06:06
06:06