Skip to main content
Introductory Statistics
My Course
Learn
Exam Prep
AI Tutor
Study Guides
Textbook Solutions
Flashcards
Explore
Try the app
My Course
Learn
Exam Prep
AI Tutor
Study Guides
Textbook Solutions
Flashcards
Explore
Try the app
Back
Uniform Distribution quiz
You can tap to flip the card.
What is the main difference between discrete and continuous random variables?
You can tap to flip the card.
👆
What is the main difference between discrete and continuous random variables?
Discrete random variables can only take specific, separate values, while continuous random variables can take any value within a range.
Track progress
Control buttons has been changed to "navigation" mode.
1/15
Related flashcards
Related practice
Recommended videos
Uniform Distribution definitions
Uniform Distribution
15 Terms
Uniform Distribution
6. Normal Distribution and Continuous Random Variables
5 problems
Topic
Ernest
Standard Normal Distribution
6. Normal Distribution and Continuous Random Variables
7 problems
Topic
Laura
6. Normal Distribution and Continuous Random Variables
4 topics
12 problems
Chapter
Justin
Guided course
06:06
Uniform Distribution
3483
views
17
rank
4
comments
Guided course
02:50
Uniform Distribution Example 1
1453
views
39
rank
1
comments
Terms in this set (15)
Hide definitions
What is the main difference between discrete and continuous random variables?
Discrete random variables can only take specific, separate values, while continuous random variables can take any value within a range.
How are probabilities represented for continuous random variables?
Probabilities for continuous random variables are represented by the area under the probability density function over an interval.
Why can't we use a table to list all possible values of a continuous random variable?
Because there are infinitely many possible values within any range, making it impossible to list them all in a table.
What is a probability density function (PDF)?
A probability density function is a function that describes the likelihood of a continuous random variable taking on a range of values.
How do you find the probability that a continuous random variable falls within an interval?
You calculate the area under the probability density function between the endpoints of the interval.
What is the probability that a continuous random variable equals a specific value?
The probability is zero because there are infinitely many possible values, so the chance of hitting exactly one value is zero.
How is the total probability under a probability density function represented?
The total area under the probability density function is always equal to one.
What is a uniform distribution?
A uniform distribution is a continuous probability distribution where every value within a certain range has the same probability density.
How can you recognize a uniform distribution from its graph?
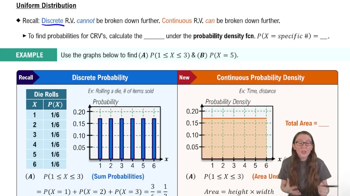
The probability density function has the same height for every value within the range, forming a rectangle.
If a uniform distribution ranges from 0 to 6, what is the height of the probability density function?
The height is 1 divided by the width of the range, so 1/6.
How do you calculate the probability that x is between 1 and 3 in a uniform distribution from 0 to 6?
Multiply the height of the PDF (1/6) by the width of the interval (2), giving a probability of 2/6.
Why is the probability that x equals 5 zero in a continuous uniform distribution?
Because the probability is based on area, and a single point has zero width, so its area and probability are zero.
What does it mean for a probability density function to have the same height everywhere?
It means the distribution is uniform, with equal likelihood for all values in the range.
Can all continuous random variables be modeled with a uniform distribution?
No, the uniform distribution is a special case; not all continuous random variables have equal probability density.
What is the sum of probabilities for all possible values of a continuous random variable?
The sum, represented by the total area under the probability density function, is always one.
 BackBack

 06:06
06:06