


Ch. 2 - Descriptive Statistics
Larson - Elementary Statistics: Picturing the World 8th Edition
Larson8th EditionElementary Statistics: Picturing the WorldISBN: 9780137493470Not the one you use?Change textbook
Chapter 2, Problem 2.5.11c

Using and Interpreting Concepts


Using and Interpreting Concepts Finding Quartiles, Interquartile Range, and Outliers In Exercises 11 and 12,
(c) identify any outliers.


56 63 51 60 57 60 60 54 63 59 80 63 60 62 65

Verified step by step guidance
1
Step 1: Arrange the data in ascending order. The given data is: 51, 54, 56, 57, 59, 60, 60, 60, 60, 62, 63, 63, 63, 65, 80.
Step 2: Find the first quartile (Q1) and third quartile (Q3). Q1 is the median of the lower half of the data (excluding the overall median), and Q3 is the median of the upper half of the data (excluding the overall median).
Step 3: Calculate the interquartile range (IQR) using the formula: IQR = Q3 - Q1.
Step 4: Determine the lower and upper bounds for outliers using the formulas: Lower Bound = Q1 - 1.5 * IQR and Upper Bound = Q3 + 1.5 * IQR.
Step 5: Identify any outliers by checking which data points fall below the lower bound or above the upper bound.

Verified video answer for a similar problem:

This video solution was recommended by our tutors as helpful for the problem above.
Video duration:
5m
Was this helpful?

Key Concepts

Here are the essential concepts you must grasp in order to answer the question correctly.

Quartiles

Quartiles are values that divide a data set into four equal parts, each containing 25% of the data. The first quartile (Q1) is the median of the lower half of the data, the second quartile (Q2) is the overall median, and the third quartile (Q3) is the median of the upper half. These values help in understanding the distribution and spread of the data.
Recommended video:
Guided course
04:51
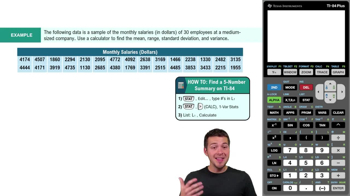
Find 5-Number Summary - TI-84 Calculator

Interquartile Range (IQR)

The interquartile range (IQR) is a measure of statistical dispersion, calculated as the difference between the third quartile (Q3) and the first quartile (Q1). It represents the range within which the central 50% of the data lies, providing insight into the variability of the data while being resistant to outliers.
Recommended video:
Guided course
05:45
Find 5-Number Summary - TI-84 Calculator Example 1

Outliers

Outliers are data points that significantly differ from the other observations in a dataset. They can be identified using the IQR method, where any value below Q1 - 1.5 * IQR or above Q3 + 1.5 * IQR is considered an outlier. Recognizing outliers is crucial as they can skew the results and affect statistical analyses.
Recommended video:
Guided course
04:48
Comparing Mean vs. Median
Related Practice
Textbook Question

Use the data set and the indicated number of classes to construct

(c) a frequency polygon,


Hospitals

Number of classes: 8

Data set: Number of hospitals in each of the 50 U.S. states and 5 inhabited territories (Source: American Hospital Directory) 10 90 51 1 77 341 56 34 8 214 111 3 14 40 18 142 102 55 75 108 72 53 19 105 55 83 1 69 19 108 10 27 14 78 37 31 186 146 90 37 177 52 11 67 25 100 361 35 91 2 7 61 78 33 14

59
views
Textbook Question

Use the ogive to approximate the

the number of black bears that weigh between 158.5 pounds and 244.5 pounds.

189
views
Textbook Question

What Would You Do? You work at a bank and are asked to recommend the amount of cash to put in an ATM each day. You do not want to put in too much (which would cause security concerns) or too little (which may create customer irritation). The daily withdrawals (in hundreds of dollars) for 30 days are listed. 72 84 61 76 104 76 86 92 80 88 98 76 97 82 84 67 70 81 82 89 74 73 86 81 85 78 82 80 91 83

If you are willing to run out of cash on 10% of the days, how much cash should you put in the ATM each day? Explain.

156
views
Textbook Question

Studying Refer to the data set in Exercise 23 and the box-and-whisker plot you drew that represents the data set.


c. You randomly select one student from the sample. What is the likelihood that the student studied less than 2 hours per day? Write your answer as a percent.

94
views
Textbook Question

Pearson’s Index of Skewness The English statistician Karl Pearson (1857–1936) introduced a formula for the skewness of a distribution.

P = 3 (x̄ - median) / s

Most distributions have an index of skewness between -3 and 3. When P > 0, the data are skewed right. When P < 0, the data are skewed left. When P = 0, the data are symmetric. Calculate the coefficient of skewness for each distribution. Describe the shape of each.


c. x̄ = 9.2, s = 1.8, median = 9.2

528
views
Textbook Question

Use the frequency histogram

describe any patterns with the data..

186
views