Textbook Question
In Exercises 1–4, find the indicated probability using the geometric distribution.
Find P(3) when p = 0.65
124
views

 Verified step by step guidance
 03:28
03:28 5:37
5:37 05:54
05:54In Exercises 1–4, find the indicated probability using the geometric distribution.
Find P(3) when p = 0.65
Mean, Variance, and Standard Deviation In Exercises 11–14, find the mean, variance, and standard deviation of the binomial distribution with the given values of n and p.
n = 316, p = 0.82
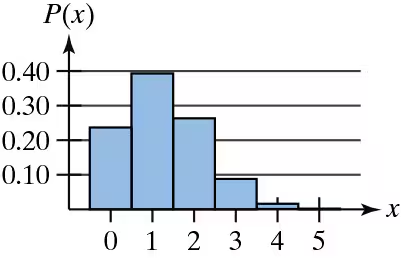
Constructing and Graphing Discrete Probability Distributions In Exercises 19 and 20, (a) construct a probability distribution, and (b) graph the probability distribution using a histogram and describe its shape.
Televisions The number of high-definition (HD) televisions per household in a small town
Mean, Variance, and Standard Deviation In Exercises 11–14, find the mean, variance, and standard deviation of the binomial distribution with the given values of n and p.
n = 50, p = 0.4
Is the expected value of the probability distribution of a random variable always one of the possible values of x? Explain.v
"True or False? In Exercises 5–8, determine whether the statement is true or false. If it is false, rewrite it as a true statement.
The mean of the random variable of a probability distribution describes how the outcomes vary."