Ch. 8 - Hypothesis Testing with Two Samples
Larson - Elementary Statistics: Picturing the World 8th Edition
Larson8th EditionElementary Statistics: Picturing the WorldISBN: 9780137493470Not the one you use?Change textbook
Chapter 8, Problem 8.RE.28

In Exercises 25–28, determine whether a normal sampling distribution can be used. If it can be used, test the claim about the difference between two population proportions p1 and p2 at the level of significance α. Assume the samples are random and independent.


Claim: p1<p2; α=0.05


Sample statistics: x1 = 86, n1=900 and x2 = 107, n2 = 1200

Verified step by step guidance
1
Step 1: Verify the conditions for using a normal sampling distribution. To use a normal approximation for the difference between two population proportions, ensure that both sample sizes are large enough. Specifically, check that n1 * p̂1 ≥ 5, n1 * (1 - p̂1) ≥ 5, n2 * p̂2 ≥ 5, and n2 * (1 - p̂2) ≥ 5, where p̂1 = x1 / n1 and p̂2 = x2 / n2.
Step 2: Calculate the sample proportions p̂1 and p̂2 using the formulas p̂1 = x1 / n1 and p̂2 = x2 / n2. Substitute the given values: x1 = 86, n1 = 900, x2 = 107, and n2 = 1200.
Step 3: Compute the pooled proportion p̂ using the formula: p̂ = (x1 + x2) / (n1 + n2). This pooled proportion will be used to calculate the standard error of the difference between the two proportions.
Step 4: Calculate the standard error (SE) of the difference between the two proportions using the formula: SE = sqrt(p̂ * (1 - p̂) * (1/n1 + 1/n2)). Substitute the values for p̂, n1, and n2 into the formula.
Step 5: Perform the hypothesis test. Compute the test statistic z using the formula: z = (p̂1 - p̂2) / SE. Compare the calculated z-value to the critical z-value for α = 0.05 (one-tailed test). If z is less than the critical value, reject the null hypothesis and conclude that p1 < p2; otherwise, fail to reject the null hypothesis.

Verified video answer for a similar problem:

This video solution was recommended by our tutors as helpful for the problem above.
Video duration:
6m
Was this helpful?

Key Concepts

Here are the essential concepts you must grasp in order to answer the question correctly.

Normal Sampling Distribution

A normal sampling distribution is a probability distribution of sample means or proportions that approximates a normal distribution as the sample size increases, according to the Central Limit Theorem. For proportions, this approximation is valid when both np and n(1-p) are greater than 5, ensuring that the sample size is sufficiently large to yield reliable results.
Recommended video:
05:11
Sampling Distribution of Sample Proportion

Hypothesis Testing

Hypothesis testing is a statistical method used to make inferences about population parameters based on sample data. In this context, it involves formulating a null hypothesis (H0) and an alternative hypothesis (H1), then using sample statistics to determine whether to reject H0 in favor of H1, based on a specified significance level (α).
Recommended video:
Guided course
06:21
Step 1: Write Hypotheses

Difference Between Two Proportions

The difference between two proportions is a statistical measure used to compare the proportions of two different groups. In this case, it involves calculating the difference between the sample proportions p1 and p2, and assessing whether this difference is statistically significant using a z-test for proportions, which helps determine if the observed difference is likely due to chance.
Recommended video:
Guided course
08:09
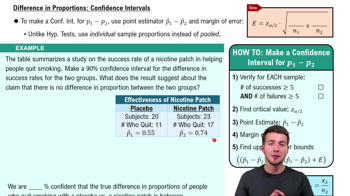
Difference in Proportions: Confidence Intervals
Related Practice
Textbook Question

In Exercises 5–8, test the claim about the difference between two population means μ1 and μ2 at the level of significance α. Assume the samples are random and independent, and the populations are normally distributed.


Claim: μ1=μ2; α=0.01


Population statistics: σ1= 52 and σ2= 68


Sample statistics: x̅1 = 5595, n1 = 156, and x̅2= 5575, n2= 216

42
views
Textbook Question

In Exercises 11–16, test the claim about the difference between two population means μ1 and μ2 at the level of significance α. Assume the samples are random and independent, and the populations are normally distributed.


Claim: μ1≠ μ2; α=0.01. Assume (σ1)^2 = (σ2)^2


Sample statistics: x̅1= 61, s1= 3.3, n1= 5 and x̅2= 55.1, s2= 1.2, n2= 7

50
views
Textbook Question

In Exercises 11–16, test the claim about the difference between two population means μ1 and μ2 at the level of significance α. Assume the samples are random and independent, and the populations are normally distributed.


Claim: μ1< μ2; α=0.10. Assume (σ1)^2 ≠ (σ2)^2


Sample statistics: x̅1=0.015, s1=0.011, n1= 8 and x̅2=0.019, s2=0.004, n2= 6

68
views
Textbook Question

"In Exercises 9 and 10, (a) identify the claim and state Ho and Ha , (b) find the critical value(s) and identify the rejection region(s), (c) find the standardized test statistic z, (d) decide whether to reject or fail to reject the null hypothesis, and (e) interpret the decision in the context of the original claim. Assume the samples are random and independent, and the populations are normally distributed.


A career counselor claims that the mean annual salaries of entry level paralegals in Dayton, Ohio, and Coventry, Rhode Island, are the same. The mean annual salary of 40 randomly selected entry level paralegals in Dayton is \$58,180. Assume the population standard deviation is \$10,990. The mean annual salary of 35 randomly selected entry level paralegals in Coventry is \$61,120. Assume the population standard deviation is \$11,850. At α=0.10, is there enough evidence to reject the counselor’s claim? (Adapted from Salary.com)"

40
views
Textbook Question

In Exercises 17 and 18, (a) identify the claim and state Ho and Ha, Assume the samples are random and independent, and the populations are normally distributed.


A real estate agent claims that there is no difference between the mean household incomes of two neighborhoods. The mean income of 12 randomly selected households from the first neighborhood is \$52,750 with a standard deviation of \$2900. In the second neighborhood, 10 randomly selected households have a mean income of \$51,200 with a standard deviation of \$2225. At α=0.01, can you reject the real estate agent’s claim? Assume the population variances are equal.

44
views
Textbook Question

In Exercises 5–8, test the claim about the difference between two population means μ1 and μ2 at the level of significance α. Assume the samples are random and independent, and the populations are normally distributed.


Claim: μ1<μ2; α=0.10


Population statistics: σ1= 0.11 and σ2= 0.10


Sample statistics: x̅1 = 0.28, n1 = 41, and x̅2= 0.33, n2= 34

45
views