

Ch. 8 - Hypothesis Testing with Two Samples
Larson - Elementary Statistics: Picturing the World 8th Edition
Larson8th EditionElementary Statistics: Picturing the WorldISBN: 9780137493470Not the one you use?Change textbook
Chapter 8, Problem 8.3.18e

Testing the Difference Between Two Means (e) decide whether to reject or fail to reject the null hypothesis. Assume the samples are random and dependent, and the populations are normally distributed.
[APPLET] Passing Play Percentages The passing play percentages of 10 randomly selected NCAA Division 1A college football teams for home and away games in the 2020–2021 season are shown in the table. At , α=0.20 is there enough evidence to support the claim that passing play percentage is different for home and away games? (Source: TeamRankings)


Table comparing home and away passing play percentages for 10 NCAA Division 1A college football teams.

Verified step by step guidance
1
Step 1: Formulate the null and alternative hypotheses. The null hypothesis (H₀) states that there is no difference in the passing play percentages for home and away games (mean difference = 0). The alternative hypothesis (H₁) states that there is a difference in the passing play percentages for home and away games (mean difference ≠ 0).
Step 2: Calculate the differences between the home and away passing play percentages for each college team. For example, for College 1, the difference is 54.3 - 52.9 = 1.4. Repeat this for all 10 colleges.
Step 3: Compute the mean and standard deviation of the differences. Use the formulas for the sample mean and sample standard deviation: Mean = (Σd) / n, where d represents the differences, and Standard Deviation = sqrt(Σ(d - Mean)² / (n - 1)).
Step 4: Perform a paired t-test. Calculate the test statistic using the formula: t = (Mean difference) / (Standard deviation of differences / sqrt(n)), where n is the number of paired observations. The degrees of freedom for the test are n - 1.
Step 5: Compare the calculated t-value to the critical t-value at α = 0.20 and degrees of freedom = n - 1. If the absolute value of the calculated t-value exceeds the critical t-value, reject the null hypothesis; otherwise, fail to reject the null hypothesis.

Verified video answer for a similar problem:

This video solution was recommended by our tutors as helpful for the problem above.
Video duration:
2m
Was this helpful?

Key Concepts

Here are the essential concepts you must grasp in order to answer the question correctly.

Null Hypothesis

The null hypothesis is a statement that there is no effect or no difference between groups in a statistical test. In this context, it posits that there is no difference in passing play percentages between home and away games for the selected college football teams. Testing this hypothesis involves comparing sample data to determine if observed differences are statistically significant.
Recommended video:
Guided course
06:21
Step 1: Write Hypotheses

Dependent Samples

Dependent samples refer to pairs of observations that are related or matched in some way, such as measurements taken from the same subjects under different conditions. In this scenario, the passing play percentages for home and away games are dependent because they come from the same teams, allowing for a paired t-test to assess differences effectively.
Recommended video:
05:17
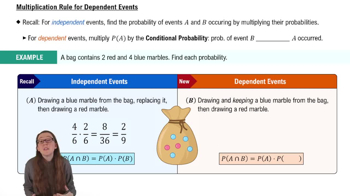
Multiplication Rule: Dependent Events

Significance Level (α)

The significance level, denoted as α, is the threshold for determining whether to reject the null hypothesis. In this case, α is set at 0.20, meaning there is a 20% risk of concluding that a difference exists when there is none. This relatively high significance level indicates a willingness to accept more false positives in the analysis of the passing play percentages.
Recommended video:
03:33
Finding Binomial Probabilities Using TI-84 Example 1
Related Practice
Textbook Question

Testing the Difference Between Two Means (e) decide whether to reject or fail to reject the null hypothesis, Assume the samples are random and dependent, and the populations are normally distributed.

[APPLET] Migraines

A researcher claims that injections of onabotulinumtoxinA reduce the number of days per month that chronic migraine sufferers have headaches. The table shows the number of days chronic migraine sufferers suffered migraines before and after using the treatment. At , α= 0.01 is there enough evidence to support the researcher’s claim? (Adapted from Journal of Headache and Pain)

76
views
Textbook Question

Testing the Difference Between Two Means (d) find the standardized test statistic t, Assume the samples are random and dependent, and the populations are normally distributed.

[APPLET] Migraines

A researcher claims that injections of onabotulinumtoxinA reduce the number of days per month that chronic migraine sufferers have headaches. The table shows the number of days chronic migraine sufferers suffered migraines before and after using the treatment. At , α= 0.01 is there enough evidence to support the researcher’s claim? (Adapted from Journal of Headache and Pain)

49
views
Textbook Question

Testing the Difference Between Two Means (f) interpret the decision in the context of the original claim. Assume the samples are random and dependent, and the populations are normally distributed.

[APPLET] Migraines

A researcher claims that injections of onabotulinumtoxinA reduce the number of days per month that chronic migraine sufferers have headaches. The table shows the number of days chronic migraine sufferers suffered migraines before and after using the treatment. At , α= 0.01 is there enough evidence to support the researcher’s claim? (Adapted from Journal of Headache and Pain)

53
views
Textbook Question

Testing the Difference Between Two Means (f) interpret the decision in the context of the original claim. Assume the samples are random and dependent, and the populations are normally distributed.

[APPLET] Passing Play Percentages The passing play percentages of 10 randomly selected NCAA Division 1A college football teams for home and away games in the 2020–2021 season are shown in the table. At , α=0.20 is there enough evidence to support the claim that passing play percentage is different for home and away games? (Source: TeamRankings)

64
views
Textbook Question

Testing the Difference Between Two Means, (e) interpret the decision in the context of the original claim. 

Assume the samples are random and independent, and the populations are normally distributed.

Transactions

 A magazine claims that the mean amount spent by a customer at Burger Stop is greater than the mean amount spent by a customer at Fry World. The results for samples of customer transactions for the two fast food restaurants are shown at the left. At , α=0.05 can you support the magazine’s claim? Assume the population variances are equal.

31
views
Textbook Question

Testing the Difference Between Two Means (e) decide whether to reject or fail to reject the null hypothesis, Assume the samples are random and dependent, and the populations are normally distributed.

Interval Training

A researcher claims that sprint interval training improves running performance in trained athletes. The table shows the maximum aerobic speed (MAS), in kilometers per hour, of trained athletes before and after six sessions of sprint interval training. At , α=0.10 is there enough evidence to support the researcher’s claim? (Adapted from National Strength and Conditioning Association)

54
views