

Ch. 2 - Exploring Data with Tables and Graphs
Triola - Elementary Statistics 14th Edition
Triola14th EditionElementary StatisticsISBN: 9780137366446Not the one you use?Change textbook
Chapter 2, Problem 2.1.8

In Exercises 5–8, identify the class width, class midpoints, and class boundaries for the given frequency distribution. Also identify the number of individuals included in the summary. The frequency distributions are based on real data from Appendix B.
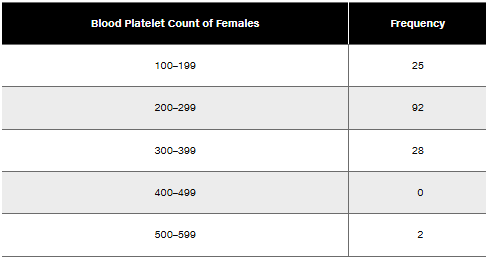
8. Table displaying blood platelet count ranges for females alongside their corresponding frequencies.

Verified step by step guidance
1
Step 1: Identify the class width. The class width is calculated by subtracting the lower boundary of one class from the lower boundary of the next class. For example, subtract 100 from 200 to get the class width: 200 - 100 = 100.
Step 2: Calculate the class midpoints. The midpoint of each class is found by averaging the lower and upper boundaries of the class. For example, for the first class (100–199), the midpoint is (100 + 199) / 2 = 149.5. Repeat this for all classes.
Step 3: Determine the class boundaries. The boundaries are calculated by subtracting 0.5 from the lower limit and adding 0.5 to the upper limit of each class. For example, for the first class (100–199), the boundaries are 99.5 and 199.5. Repeat this for all classes.
Step 4: Sum the frequencies to find the total number of individuals included in the summary. Add all the frequencies together: 25 + 92 + 28 + 0 + 2.
Step 5: Verify the calculations and ensure all values (class width, midpoints, boundaries, and total frequency) are consistent with the given data.

Verified video answer for a similar problem:

This video solution was recommended by our tutors as helpful for the problem above.
Video duration:
4m
Was this helpful?

Key Concepts

Here are the essential concepts you must grasp in order to answer the question correctly.

Class Width

Class width refers to the range of values that each class interval covers in a frequency distribution. It is calculated by subtracting the lower boundary of a class from its upper boundary. For example, in the class interval 100-199, the class width is 199 - 100 = 99. Understanding class width is essential for accurately interpreting the distribution of data.
Recommended video:
Guided course
05:18
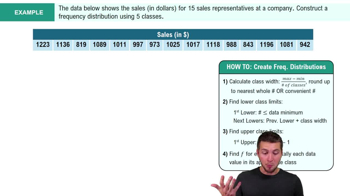
How to Create Frequency Distributions Example 2

Class Midpoint

The class midpoint is the value that lies in the middle of a class interval and is calculated by averaging the upper and lower boundaries of the class. For instance, for the class interval 100-199, the midpoint is (100 + 199) / 2 = 149.5. Class midpoints are useful for summarizing data and performing further statistical analysis.
Recommended video:
04:15
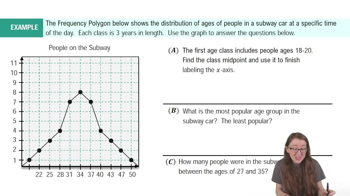
Frequency Polygons Example 1

Class Boundaries

Class boundaries are the values that separate one class interval from another in a frequency distribution. They are typically calculated by taking the average of the upper limit of one class and the lower limit of the next class. For example, the boundary between the classes 100-199 and 200-299 would be 199.5. Class boundaries help in accurately grouping data and avoiding overlaps between classes.
Recommended video:
Guided course
07:10
How to Create Histogram - TI-84 Calculator
Related Practice
Textbook Question

Births Natural births randomly selected from four hospitals in New York State occurred on the days of the week (in the order of Monday through Sunday) with these frequencies: 52, 66, 72, 57, 57, 43, 53. Does it appear that such births occur on the days of the week with equal frequency?

202
views
Textbook Question

In Exercises 9–18, construct the histograms and answer the given questions.

Chicago Commute Time Use the frequency distribution from Exercise 13 in Section 2-1 to construct a histogram. Does it appear to be the graph of data from a population with a normal distribution?

185
views
Textbook Question

In Exercises 5–8, answer the questions by referring to the following Minitab-generated histogram, which depicts the weights (grams) of all quarters listed in Data Set 40 “Coin Weights” in Appendix B. (Grams are actually units of mass and the values shown on the horizontal scale are rounded.)


Sample Size What is the approximate number of quarters depicted in the three bars farthest to the left?

165
views
Textbook Question

Boston Commute Time The accompanying table summarizes daily commute times in Boston. How many commute times are included in the summary? Is it possible to identify the exact values of all of the original data amounts?

191
views
Textbook Question

In Exercises 15 and 16, construct the frequency polygons.


Chicago Commute Times Use the frequency distribution from Exercise 13 in Section 2-1 to construct a frequency polygon. Does the graph suggest that the distribution is skewed? If so, how?


111
views
Textbook Question

In Exercises 9–18, construct the histograms and answer the given questions.


Old Faithful Use the frequency distribution from Exercise 15 in Section 2-1 to construct a histogram. Does it appear to be the graph of data from a population with a normal distribution?

147
views