


Ch. 9 - Inferences from Two Samples
Triola - Elementary Statistics 14th Edition
Triola14th EditionElementary StatisticsISBN: 9780137366446Not the one you use?Change textbook
Chapter 9, Problem 9.4.17c

Count Five Test for Comparing Variation in Two Populations Repeat Exercise 16 “Blanking Out on Tests,” but instead of using the F test, use the following procedure for the “count five” test of equal variations (which is not as complicated as it might appear).
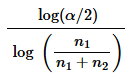
c. If the sample sizes are equal (n1 = n2) use a critical value of 5. If n1 is not equals to n2 calculate the critical value shown below.
Mathematical formula showing log(alpha/2) divided by log(n1 divided by (n1 plus n2)) for critical value calculation.

Verified step by step guidance
1
Step 1: Understand the Count Five Test procedure. This test compares the variation in two populations by counting how many observations in each sample fall outside the range of the other sample. Specifically, you count the number of observations in sample 1 that are less than the minimum or greater than the maximum of sample 2, and vice versa. Then, sum these counts to get the test statistic.
Step 2: Determine the sample sizes n1 and n2 for the two populations. If the sample sizes are equal (n1 = n2), the critical value for the test is given as 5. This means if the total count from Step 1 exceeds 5, you reject the null hypothesis of equal variation.
Step 3: If the sample sizes are not equal (n1 ≠ n2), calculate the critical value using the formula: \[\text{Critical Value} = \frac{\log(\alpha/2)}{\log\left(\frac{n_1}{n_1 + n_2}\right)}\] where \(\alpha\) is the significance level (commonly 0.05). This formula adjusts the critical value based on the relative sizes of the two samples.
Step 4: Compare the test statistic (the total count from Step 1) to the critical value obtained in Step 2 or Step 3. If the test statistic is greater than the critical value, reject the null hypothesis that the two populations have equal variation.
Step 5: Interpret the result in the context of the problem. A rejection indicates evidence that the variation in the two populations differs, while failure to reject suggests no significant difference in variation.

Verified video answer for a similar problem:

This video solution was recommended by our tutors as helpful for the problem above.
Video duration:
7m
Was this helpful?

Key Concepts

Here are the essential concepts you must grasp in order to answer the question correctly.

Count Five Test for Equality of Variances

The Count Five Test is a non-parametric method used to compare the variability between two populations. It involves counting how many observations in each sample fall outside the range of the other sample's data. If the count exceeds a critical value, the null hypothesis of equal variances is rejected.
Recommended video:
07:11
Introduction to Permutations

Critical Value Calculation for Unequal Sample Sizes

When sample sizes differ (n1 ≠ n2), the critical value for the Count Five Test is calculated using a logarithmic formula involving the significance level (α) and the sample sizes. This adjusts the threshold for rejecting the null hypothesis to account for unequal sample sizes, ensuring the test's accuracy.
Recommended video:
05:50
Critical Values: t-Distribution

Logarithmic Functions in Statistical Testing

Logarithms are used in the formula to transform ratios and probabilities into a linear scale, simplifying the calculation of critical values. In this context, the log function helps relate the significance level and sample size ratio to determine the appropriate critical value for the test.
Recommended video:
Guided course
06:34
Step 2: Calculate Test Statistic
Related Practice
Textbook Question

Count Five Test for Comparing Variation in Two Populations Repeat Exercise 16 “Blanking Out on Tests,” but instead of using the F test, use the following procedure for the “count five” test of equal variations (which is not as complicated as it might appear).

d. If c1 equal to or greater than critical value then conclude that sigma2,1 > sigma2,2 If c1 equal to or greater than critical value then conclude that sigma2,2 > sigma2,1. Otherwise, fail to reject the null hypothesis of sigma2,1 = sigma2,2

32
views
Textbook Question

Independent Samples Which of the following involve independent samples?


c. Data Set 1 “Body Data” includes a sample of pulse rates of 147 women and a sample of pulse rates of 153 men.

103
views
Textbook Question

Are Seat Belts Effective? A simple random sample of front-seat occupants involved in car crashes is obtained. Among 2823 occupants not wearing seat belts, 31 were killed. Among 7765 occupants wearing seat belts, 16 were killed (based on data from “Who Wants Airbags?” by Meyer and Finney, Chance, Vol. 18, No. 2). We want to use a 0.05 significance level to test the claim that seat belts are effective in reducing fatalities.


c. What does the result suggest about the effectiveness of seat belts?

111
views
Textbook Question

In Exercises 5–20, assume that the two samples are independent simple random samples selected from normally distributed populations, and do not assume that the population standard deviations are equal. (Note: Answers in Appendix D include technology answers based on Formula 9-1 along with “Table” answers based on Table A-3 with df equal to the smaller of n1-1 and n2-1)


Color and Cognition Researchers from the University of British Columbia conducted a study to investigate the effects of color on cognitive tasks. Words were displayed on a computer screen with background colors of red and blue. Results from scores on a test of word recall are given below. Higher scores correspond to greater word recall.


c. Does the background color appear to have an effect on word recall scores? If so, which color appears to be associated with higher word memory recall scores?


" style="max-width: 100%; white-space-collapse: preserve;" width="440">

74
views
Textbook Question

In Exercises 5–16, use the listed paired sample data, and assume that the samples are simple random samples and that the differences have a distribution that is approximately normal.


The Freshman 15 The “Freshman 15” refers to the belief that college students gain 15 lb (or 6.8 kg) during their freshman year. Listed below are weights (kg) of randomly selected male college freshmen (from Data Set 13 “Freshman 15” in Appendix B). The weights were measured in September and later in April.


c. What do you conclude about the Freshman 15 belief?


98
views
Textbook Question

F Test Statistic


d. Is the F distribution symmetric, skewed left, or skewed right?

234
views