Ch. 9 - Inferences from Two Samples
Triola - Elementary Statistics 14th Edition
Triola14th EditionElementary StatisticsISBN: 9780137366446Not the one you use?Change textbook
Chapter 9, Problem 9.4.17d

Count Five Test for Comparing Variation in Two Populations Repeat Exercise 16 “Blanking Out on Tests,” but instead of using the F test, use the following procedure for the “count five” test of equal variations (which is not as complicated as it might appear).
d. If c1 equal to or greater than critical value then conclude that sigma2,1 > sigma2,2 If c1 equal to or greater than critical value then conclude that sigma2,2 > sigma2,1. Otherwise, fail to reject the null hypothesis of sigma2,1 = sigma2,2

Verified step by step guidance
1
Understand the goal: We want to compare the variances of two populations, \( \sigma_1^2 \) and \( \sigma_2^2 \), using the Count Five Test, which is a non-parametric alternative to the F test for equality of variances.
Combine the two samples and find the overall median of the combined data. This median will be used as a reference point to count observations in each sample.
For each sample, count the number of observations that lie above the overall median and the number that lie below the overall median. Specifically, for each sample, determine how many data points are greater than the median and how many are less than the median.
Calculate \( c_1 \) as the maximum of these four counts (i.e., the largest count of observations above or below the median in either sample). This value \( c_1 \) summarizes the degree of variation difference between the two samples.
Compare \( c_1 \) to the critical value from the Count Five Test table (based on sample sizes and significance level). If \( c_1 \) is greater than or equal to the critical value, conclude which population variance is larger based on which sample had the larger count. Otherwise, fail to reject the null hypothesis that the variances are equal.

Verified video answer for a similar problem:

This video solution was recommended by our tutors as helpful for the problem above.
Video duration:
5m
Was this helpful?

Key Concepts

Here are the essential concepts you must grasp in order to answer the question correctly.

Count Five Test

The Count Five Test is a non-parametric method used to compare the variances of two populations. It involves counting how many observations in each sample fall outside the range defined by the other sample's median and spread. This count is then compared to a critical value to decide if one variance is significantly larger than the other, providing a simpler alternative to the F test.
Recommended video:
04:04
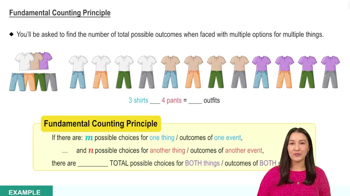
Fundamental Counting Principle

Hypothesis Testing for Variance Equality

This involves formulating a null hypothesis that the variances of two populations are equal (σ1² = σ2²) and an alternative hypothesis that they differ. The test statistic, derived from sample data, is compared against a critical value to decide whether to reject the null hypothesis, indicating a significant difference in variability between the populations.
Recommended video:
05:52
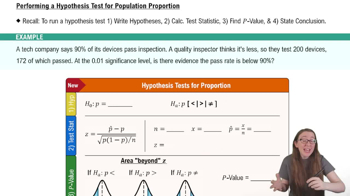
Performing Hypothesis Tests: Proportions

Critical Value and Decision Rule

The critical value is a threshold determined by the significance level and sample size, used to evaluate the test statistic. If the test statistic (c1) is equal to or exceeds this critical value, the null hypothesis is rejected, indicating unequal variances. Otherwise, the null hypothesis is not rejected, suggesting no significant difference in population variances.
Recommended video:
05:50
Critical Values: t-Distribution
Related Practice
Textbook Question

P-VALUE The test statistic of z = 2.14 is obtained when using the data from Exercise 1 and testing the claim that patients treated with dexamethasone and patients given a placebo have the same rate of complete resolution.


a. Find the P-value for the test.

112
views
Textbook Question

Count Five Test for Comparing Variation in Two Populations Repeat Exercise 16 “Blanking Out on Tests,” but instead of using the F test, use the following procedure for the “count five” test of equal variations (which is not as complicated as it might appear).

c. If the sample sizes are equal (n1 = n2) use a critical value of 5. If n1 is not equals to n2 calculate the critical value shown below.

25
views
Textbook Question

In Exercises 5–20, assume that the two samples are independent simple random samples selected from normally distributed populations, and do not assume that the population standard deviations are equal. (Note: Answers in Appendix D include technology answers based on Formula 9-1 along with “Table” answers based on Table A-3 with df equal to the smaller of n1-1 and n2-1)


Color and Cognition Researchers from the University of British Columbia conducted a study to investigate the effects of color on cognitive tasks. Words were displayed on a computer screen with background colors of red and blue. Results from scores on a test of word recall are given below. Higher scores correspond to greater word recall.


c. Does the background color appear to have an effect on word recall scores? If so, which color appears to be associated with higher word memory recall scores?


" style="max-width: 100%; white-space-collapse: preserve;" width="440">

74
views
Textbook Question

In Exercises 5–16, use the listed paired sample data, and assume that the samples are simple random samples and that the differences have a distribution that is approximately normal.


The Freshman 15 The “Freshman 15” refers to the belief that college students gain 15 lb (or 6.8 kg) during their freshman year. Listed below are weights (kg) of randomly selected male college freshmen (from Data Set 13 “Freshman 15” in Appendix B). The weights were measured in September and later in April.


c. What do you conclude about the Freshman 15 belief?


98
views
Textbook Question

Denomination Effect A trial was conducted with 75 women in China given a 100-yuan bill, while another 75 women in China were given 100 yuan in the form of smaller bills (a 50-yuan bill plus two 20-yuan bills plus two 5-yuan bills). Among those given the single bill, 60 spent some or all of the money. Among those given the smaller bills, 68 spent some or all of the money (based on data from “The Denomination Effect,” by Raghubir and Srivastava, Journal of Consumer Research, Vol. 36). We want to use a 0.05 significance level to test the claim that when given a single large bill, a smaller proportion of women in China spend some or all of the money when compared to the proportion of women in China given the same amount in smaller bills.


a. Test the claim using a hypothesis test.

160
views
Textbook Question

F Test Statistic


d. Is the F distribution symmetric, skewed left, or skewed right?

234
views