- Download the worksheet to save time writing
- Start solving the practice problems
- If you're stuck, watch the video solutions
- See your summary to get more insights

If a residual plot shows residuals spreading further from zero as x increases, what should you do?
What does a positive residual indicate about a data point in regression analysis?
Given observed y-values [3, 5, 7] and predicted y-values [2, 6, 8], what is the sum of squared residuals?
A residual plot for a dataset shows residuals forming a wave-like pattern. What is the most appropriate conclusion?
Which of the following residual patterns suggests that the regression model is NOT valid?
The table shows the average vehicle age (in years) for each of the eight years. A regression model has been fit to the data:
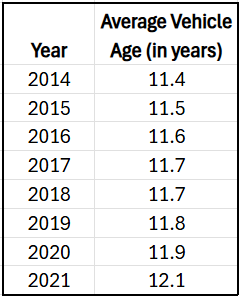
Using this regression model and the actual data, compute the standard error of estimate , which measures the typical distance between observed and predicted values.
In a study examining the relationship between study hours and test scores, a linear regression line was fitted to the data. One student studied for hours and scored , while the average test score of all students was . Which of the following best describes the explained variation for this student?
Which of the following best defines a residual in linear regression?
You are given two possible regression lines for a dataset. Line A has a sum of squared residuals of 12, and Line B has a sum of squared residuals of 8. Which line should you choose and why?
A real estate analyst recorded the average house size (in hundreds of square feet) and corresponding average sale price (in ) for neighborhoods:
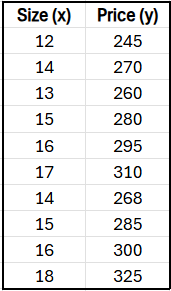
Find the standard error of estimate interpret the result.