 Back
BackPopulation Genetics: Principles, Equilibrium, and Evolutionary Forces
Study Guide - Smart Notes
 Tailored notes based on your materials, expanded with key definitions, examples, and context.
Population Genetics: Concepts and Major Shifts
Genetics vs. Population Genetics
Population genetics is the study of genetic variation within populations and the evolutionary forces that shape this variation. Unlike classical genetics, which focuses on individuals and their inheritance patterns, population genetics examines groups of interbreeding individuals and their collective gene pool.
Population: A group of interbreeding individuals of the same species in a defined locality.
Gene pool: The collection of genes and alleles found in the members of a population.
Evolution: Change in the genetic makeup of a population across generations, measured as changes in allele or genotype frequencies.
Genetic variation: Population genetics emphasizes naturally occurring genetic variability, rather than minimizing variation.
Time scale: Population genetic phenomena may occur over decades, centuries, or millennia.
Hardy-Weinberg Equilibrium (H-W Equilibrium)
Assumptions and Canonical Equation
The Hardy-Weinberg equilibrium describes a theoretical population in which allele and genotype frequencies remain constant from generation to generation, provided certain assumptions are met:
No natural selection
No mutation
No gene flow (migration)
Very large population size (no genetic drift)
Random mating
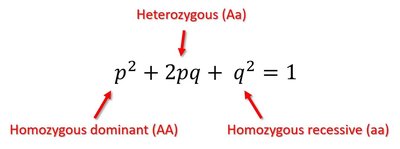
For a gene with two alleles (A1 and A2):
Allele frequencies: p + q = 1, where p = frequency of A1, q = frequency of A2
Genotype frequencies: A1A1 = p2, A1A2 = 2pq, A2A2 = q2
Sum of genotype frequencies: p2 + 2pq + q2 = 1
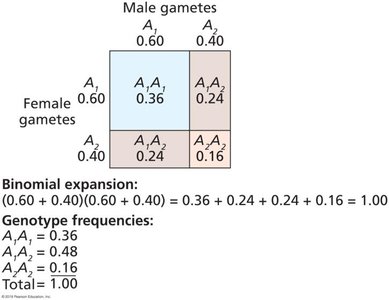
Genotype Frequency Calculation Example
For a population with allele frequencies p = 0.60 and q = 0.40:
A1A1: 0.36
A1A2: 0.48
A2A2: 0.16
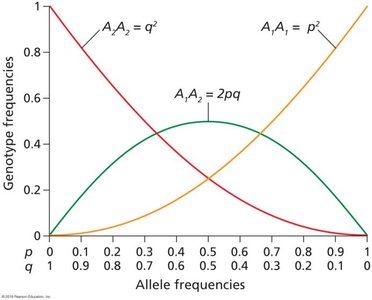
Genotype Frequency vs. Allele Frequency
Genotype frequencies change as allele frequencies change, following the H-W equation.
Practice Problem: PKU Disease
Phenylketonuria (PKU) is an autosomal recessive disease. If PKU occurs in 1 per 10,000 births (q2 = 0.0001), then:
q = 0.01
p = 0.99
Carrier frequency = 2pq = 2 × 0.99 × 0.01 = 0.0198 (~2%)
Complex Cases: More Than Two Alleles
For genes with more than two alleles, the H-W equation expands:
Violations of Hardy-Weinberg Equilibrium
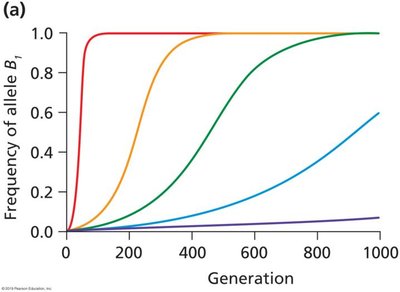
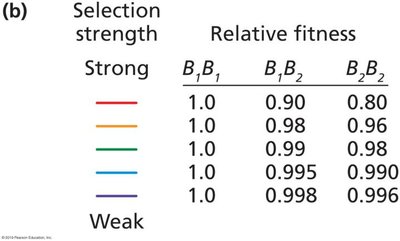
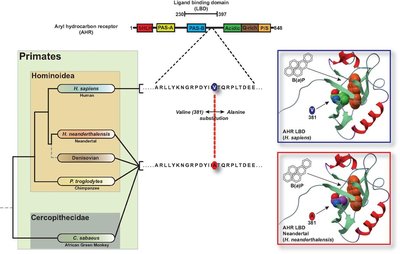
Natural Selection
Selection pressures can alter allele frequencies. Directional selection favors one allele, while balanced polymorphism can occur if heterozygotes have higher fitness.
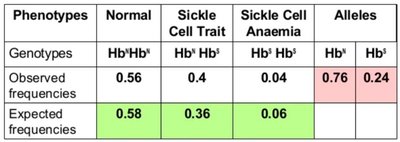
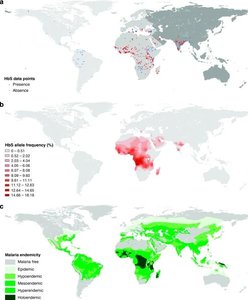
Example: Sickle Cell Anemia
Heterozygotes for the HbS allele are resistant to malaria (overdominance), while homozygotes have sickle cell disease. This results in a balanced polymorphism in regions where malaria is endemic.
Mutation
Mutations introduce new alleles or revert alleles to wild-type. The frequency of recessive mutant alleles is determined by mutation-selection balance.
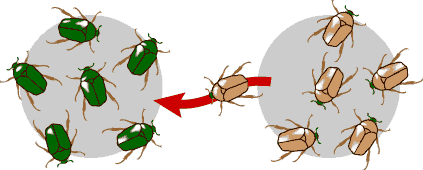
Gene Flow
Migration between populations introduces or removes alleles, resulting in gene flow. Populations affected by gene flow are termed admixed.
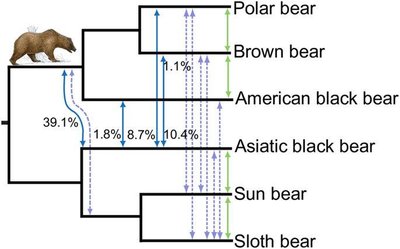
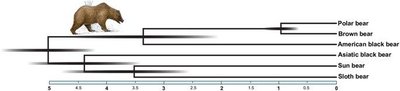
Example: Bear Hybridization
Genomic analysis reveals significant gene flow between polar, brown, and other bear species, indicating complex evolutionary relationships.
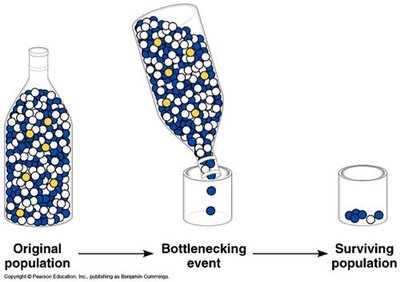
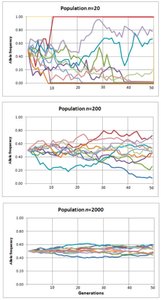
Genetic Drift
Genetic drift is the random change in allele frequencies due to sampling error, most pronounced in small populations. Two key effects:
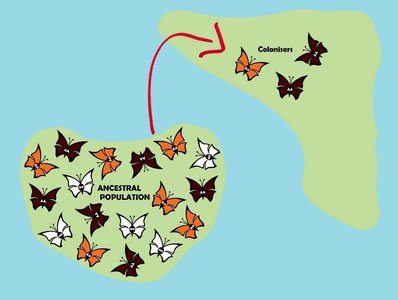
Founder effect: New population founded by a small group.
Bottleneck effect: Population size reduction followed by increase.
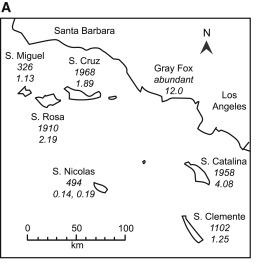
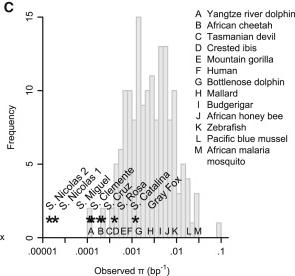
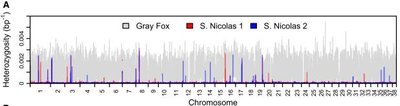
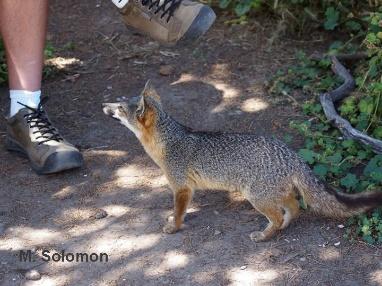
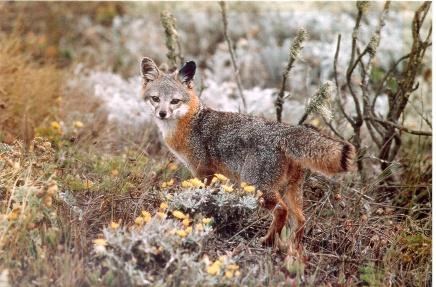
Example: Channel Island Gray Foxes
Small, isolated populations of gray foxes exhibit reduced genetic diversity due to genetic drift.
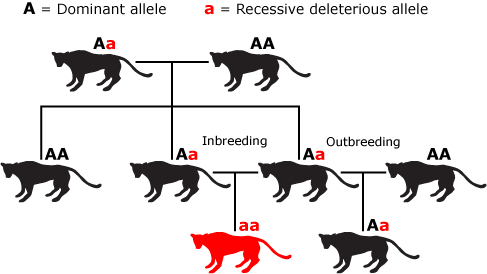
Non-Random Mating
Non-random mating alters genotype frequencies but not allele frequencies. Inbreeding increases homozygosity and can cause inbreeding depression, while outbreeding can sometimes cause outbreeding depression.
Effective Population Size (Ne), Drift, and Selection
Definitions and Calculation
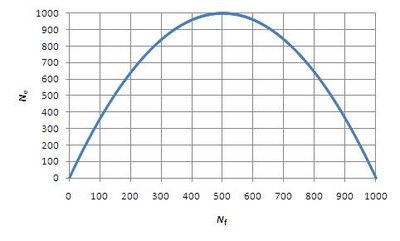
Effective population size (Ne) is the number of reproducing individuals in a population, often much smaller than the census size (Nc). Ne is calculated using:
Where Nm = number of breeding males, Nf = number of breeding females
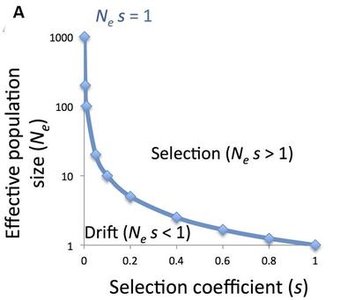
Drift vs. Selection: Population Size Effects
Genetic drift is stronger in small populations, while natural selection is more influential in large populations. The tipping point is determined by the product Ne × s (effective population size × selection coefficient):
If Ne × s < 1, drift dominates
If Ne × s > 1, selection dominates
Relative Fitness (w) and Selection Coefficient (s)
Relative fitness (w) measures the reproductive success of a genotype compared to the most fit genotype. The selection coefficient (s) quantifies the cost of an allele or genotype:
High s = low fitness (costly allele)
Low s = high fitness (beneficial allele)
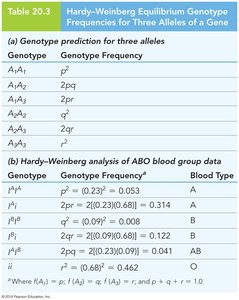
Summary Table: Hardy-Weinberg Equilibrium for Three Alleles
Genotype | Genotype Frequency |
|---|---|
A1A1 | p2 |
A2A2 | q2 |
A3A3 | r2 |
A1A2 | 2pq |
A1A3 | 2pr |
A2A3 | 2qr |
Key Takeaways
Population genetics studies genetic variation and evolutionary forces in populations.
Hardy-Weinberg equilibrium provides a baseline for detecting evolutionary change.
Violations of H-W equilibrium (selection, mutation, gene flow, drift, non-random mating) drive evolution.
Effective population size determines the relative strength of drift and selection.
Relative fitness and selection coefficient quantify evolutionary impact of alleles.
