Skip to main content
GOB Chemistry
My Course
Learn
Exam Prep
AI Tutor
Study Guides
Textbook Solutions
Flashcards
Explore
Try the app
My Course
Learn
Exam Prep
AI Tutor
Study Guides
Textbook Solutions
Flashcards
Explore
Try the app
Back
Energy Diagrams quiz
You can tap to flip the card.
What does an energy diagram illustrate in a chemical reaction?
You can tap to flip the card.
👆
What does an energy diagram illustrate in a chemical reaction?
It shows the energies of reactants, products, and the transition state as the reaction progresses.
Track progress
Control buttons has been changed to "navigation" mode.
1/15
Related flashcards
Related practice
Recommended videos
Energy Diagrams definitions
Energy Diagrams
15 Terms
Energy Diagrams
7. Energy, Rate and Equilibrium
5 problems
Topic
Jules
7. Energy, Rate and Equilibrium - Part 1 of 3
5 topics
11 problems
Chapter
Jules
7. Energy, Rate and Equilibrium - Part 2 of 3
5 topics
11 problems
Chapter
Jules
7. Energy, Rate and Equilibrium - Part 3 of 3
3 topics
8 problems
Chapter
Jules
Guided course
02:40
Energy Diagrams Concept 1
3329
views
11
rank
Guided course
00:43
Energy Diagrams Example 2
3360
views
9
rank
Guided course
02:23
Energy Diagrams Concept 2
3474
views
9
rank
Terms in this set (15)
Hide definitions
What does an energy diagram illustrate in a chemical reaction?
It shows the energies of reactants, products, and the transition state as the reaction progresses.
Where are reactants and products located on an energy diagram?
Reactants are at the beginning (left) of the curve, and products are at the end (right) of the curve.
What is the transition state in an energy diagram?
The transition state is the highest energy point (the peak) between reactants and products.
What is another name for the transition state?
It is also called the activated complex.
What does the x-axis represent in an energy diagram?
The x-axis shows the reaction coordinate, which is the progress of the reaction.
What does the y-axis represent in an energy diagram?
The y-axis represents the change in energy, often measured in kilojoules.
How is activation energy (Ea) defined on an energy diagram?
Activation energy is the energy difference between the transition state and the reactants.
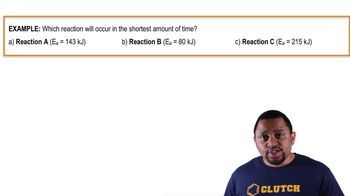
How does activation energy affect reaction speed?
A higher activation energy means a slower reaction, while a lower activation energy means a faster reaction.
How do you calculate activation energy from an energy diagram?
Subtract the energy of the reactants from the energy of the transition state.
What does a negative overall energy change (ΔE) indicate about a reaction?
A negative ΔE means the reaction is favorable and energy is released (exothermic or exergonic).
What does a positive overall energy change (ΔE) indicate about a reaction?
A positive ΔE means the reaction is unfavorable and energy is absorbed (endothermic or endergonic).
What is enthalpy (ΔH) in the context of energy diagrams?
Enthalpy is the thermal energy change during a reaction, specifically related to heat.
What is Gibbs free energy (ΔG) and what does it indicate?
Gibbs free energy measures the favorability of product formation; negative ΔG means the reaction is favorable.
How do you calculate the overall energy change (ΔE) in an energy diagram?
Subtract the energy of the reactants from the energy of the products (ΔE = products - reactants).
Why are products with lower energy considered more stable?
Lower energy means greater stability, so reactions that produce lower-energy products are more favorable.
 BackBack

 02:40
02:40