Back

Heating and Cooling Curves definitions

Control buttons has been changed to "navigation" mode.
1/15
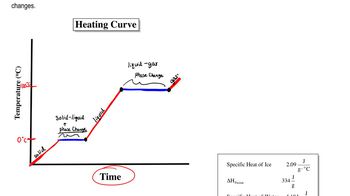
  • Heating Curve

    Graph showing temperature changes and phase transitions as a substance absorbs heat, highlighting constant temperature during phase changes.
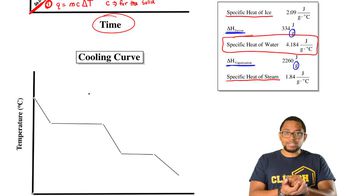
  • Cooling Curve

    Graph depicting temperature decrease and phase transitions as a substance releases heat, with flat segments at phase changes.
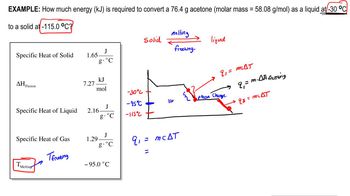
  • Phase Change

    Transition between solid, liquid, and gas where temperature remains constant and energy alters particle arrangement.
  • Melting Point

    Specific temperature where a solid becomes a liquid, marked by a flat segment on a heating curve.
  • Boiling Point

    Specific temperature where a liquid becomes a gas, indicated by a plateau on a heating curve.
  • Fusion

    Process where a solid transforms into a liquid, requiring energy input and occurring at the melting point.
  • Vaporization

    Process where a liquid turns into a gas, requiring significant energy to separate particles widely.
  • Condensation

    Process where a gas becomes a liquid, releasing energy and forming intermolecular bonds.
  • Freezing

    Process where a liquid becomes a solid, releasing energy as particles arrange into a fixed structure.
  • Potential Energy

    Stored energy related to particle arrangement, increasing as substances move from solid to gas.
  • Kinetic Energy

    Energy associated with particle motion, directly linked to temperature changes in a substance.
  • Specific Heat

    Amount of energy required to raise the temperature of one gram of a substance by one degree Celsius.
  • Endothermic Process

    Energy-absorbing transformation, such as melting or vaporization, resulting in positive heat values.
  • Exothermic Process

    Energy-releasing transformation, such as freezing or condensation, resulting in negative heat values.
  • Delta H

    Symbol representing enthalpy change during a phase transition, with sign indicating energy absorbed or released.