

Ch. 12 - Infrared Spectroscopy and Mass Spectrometry
Wade - Organic Chemistry 9th Edition
Wade9th EditionOrganic ChemistryISBN: 9780135213728당신이 사용하는 게 아니라요?교과서 변경
12장, 문제 31

Consider the following four structures, followed by mass spectral data. Match each structure with its characteristic molecular ion or fragment. In each case, give a likely structure of the ion responsible for the base peak.

(a) base peak at 105
(b) base peak at 72
(c) M+ doublet at 198 and 200, base peak at 91
(d) base peak at 91, large peak at 43

검증된 단계별 안내
1
Step 1: Analyze the structure labeled I. This is ethylbenzene, which contains a benzene ring attached to an ethyl group. The base peak at 91 corresponds to the tropylium ion (C7H7+), a common fragment formed from alkylbenzenes due to the stability of the tropylium ion.
Step 2: Examine structure II. This is bromobenzene, which contains a benzene ring attached to a bromine atom. The molecular ion doublet at 198 and 200 is characteristic of bromine isotopes (79Br and 81Br). The base peak at 91 again corresponds to the tropylium ion, formed from the benzene ring.
Step 3: Look at structure III. This is acetone, a simple ketone. The base peak at 72 corresponds to the molecular ion fragment resulting from the loss of a methyl group (CH3) from the parent molecule, forming the ion CH3CO+.
Step 4: Analyze structure IV. This is 1-pentene, an alkene. The base peak at 43 corresponds to the fragment CH3CH2+, which is formed from the cleavage of the alkene chain. The large peak at 43 is due to the stability of this alkyl fragment.
Step 5: Match each structure with its corresponding mass spectral data: (a) Structure III (base peak at 105), (b) Structure IV (base peak at 72), (c) Structure II (M+ doublet at 198 and 200, base peak at 91), (d) Structure I (base peak at 91, large peak at 43).

비슷한 문제에 대한 검증된 영상 답변:

이 영상 해법은 위 문제에 도움이 된다고 튜터들이 추천한 것입니다.
영상 길이:
6m

주요 개념

질문에 올바르게 답하기 위해 반드시 이해해야 하는 핵심 개념들은 다음과 같습니다.

Mass Spectrometry Basics

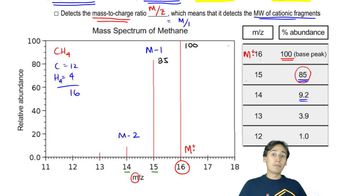
Mass spectrometry is an analytical technique used to measure the mass-to-charge ratio of ions. It involves ionizing chemical species and sorting the ions based on their mass. The resulting mass spectrum provides information about the molecular weight and structure of the compounds, including the molecular ion peak (M+) and fragment ions, which are crucial for identifying the components of a sample.
추천 영상:
01:25
How to Read a Mass Spectrum

Base Peak and Molecular Ion

The base peak in a mass spectrum is the most intense peak, representing the most stable ion formed during fragmentation. The molecular ion (M+) corresponds to the intact molecule's mass, while fragment ions result from the breakdown of the molecular ion. Understanding the relationship between these peaks helps in deducing the structure of the original compound and its fragments.
추천 영상:
01:27
Clarification on the Base Peak

Fragmentation Patterns

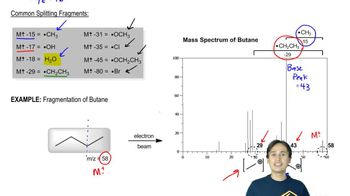
Fragmentation patterns refer to the specific ways in which a molecular ion breaks apart into smaller ions during mass spectrometry. These patterns are influenced by the structure of the molecule, including functional groups and stability of the resulting fragments. Recognizing common fragmentation pathways, such as the loss of small molecules or rearrangements, is essential for predicting the ions responsible for observed peaks in the mass spectrum.
추천 영상:
08:06
Common Splitting Patterns