Ch. 12 - Infrared Spectroscopy and Mass Spectrometry
Wade - Organic Chemistry 9th Edition
Wade9th EditionOrganic ChemistryISBN: 9780135213728당신이 사용하는 게 아니라요?교과서 변경
12장, 문제 28

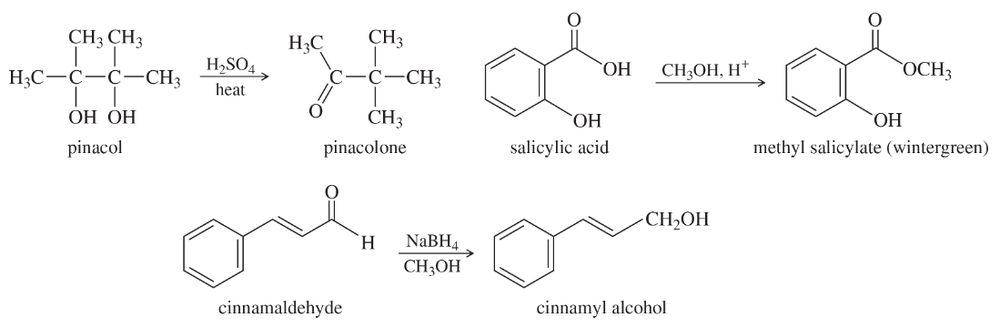
Three common lab experiments are shown. In each case, describe how the IR spectrum of the product would differ from that of the reactant. Give approximate frequencies for distinctive peaks in the IR spectrum of the reactant and also that of the product.

검증된 단계별 안내
1
Step 1: Analyze reaction A (Pinacol rearrangement). The reactant contains two hydroxyl (-OH) groups, which will show broad IR peaks around 3200-3600 cm⁻¹. The product is a ketone, which will exhibit a strong IR peak for the carbonyl (C=O) group around 1700 cm⁻¹. The disappearance of the -OH peak and the appearance of the C=O peak are key differences in the IR spectra.
Step 2: Analyze reaction B (Esterification of salicylic acid). The reactant contains a carboxylic acid group (-COOH), which will show a broad peak for the O-H stretch around 2500-3000 cm⁻¹ and a sharp peak for the C=O stretch around 1700 cm⁻¹. The product is an ester, which will show a C=O stretch around 1735 cm⁻¹ and a C-O stretch around 1200-1300 cm⁻¹. The disappearance of the broad O-H peak and the shift in the C=O peak are key differences.
Step 3: Analyze reaction C (Reduction of cinnamaldehyde). The reactant contains an aldehyde group (-CHO), which will show a C=O stretch around 1720 cm⁻¹ and a C-H stretch around 2700-2900 cm⁻¹. The product is an alcohol, which will show a broad O-H stretch around 3200-3600 cm⁻¹. The disappearance of the aldehyde peaks and the appearance of the O-H peak are key differences.
Step 4: For each reaction, identify the functional group transformation and correlate it with the IR spectral changes. Functional group transformations (e.g., hydroxyl to ketone, carboxylic acid to ester, aldehyde to alcohol) directly impact the IR spectrum by introducing or removing characteristic peaks.
Step 5: Approximate frequencies for distinctive peaks: Hydroxyl (-OH) stretch: 3200-3600 cm⁻¹, Carboxylic acid O-H stretch: 2500-3000 cm⁻¹, Carbonyl (C=O) stretch: 1700-1735 cm⁻¹, Ester C-O stretch: 1200-1300 cm⁻¹, Aldehyde C-H stretch: 2700-2900 cm⁻¹. Use these values to interpret the IR spectra of reactants and products in each case.

비슷한 문제에 대한 검증된 영상 답변:

이 영상 해법은 위 문제에 도움이 된다고 튜터들이 추천한 것입니다.
영상 길이:
5m

주요 개념

질문에 올바르게 답하기 위해 반드시 이해해야 하는 핵심 개념들은 다음과 같습니다.

Infrared (IR) Spectroscopy

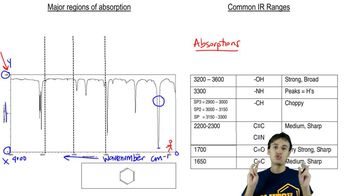
Infrared spectroscopy is a technique used to identify functional groups in organic compounds by measuring the absorption of infrared light at specific wavelengths. Different functional groups absorb IR radiation at characteristic frequencies, allowing chemists to deduce the molecular structure of a compound based on its IR spectrum.
추천 영상:
16:04
General Features of IR Spect

Functional Group Transformations

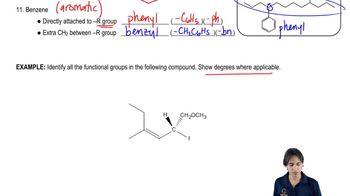
Functional group transformations refer to the chemical reactions that convert one functional group into another. In the provided reactions, the conversion of pinacol to pinacolone and the reduction of cinnamaldehyde to cinnamyl alcohol illustrate how the presence or absence of certain functional groups affects the IR spectrum, particularly in terms of peak positions and intensities.
추천 영상:
02:36
Identifying Functional Groups

Characteristic IR Peaks

Characteristic IR peaks correspond to specific bond vibrations within a molecule. For example, alcohols typically show broad O-H stretching around 3200-3600 cm⁻¹, while carbonyl groups (C=O) exhibit strong peaks near 1700 cm⁻¹. Understanding these peaks helps in predicting how the IR spectrum of a product will differ from that of its reactants after a reaction.
추천 영상:
09:26
The (M + 1) Peak
관련 실천
교과서 질문

These five structures all have distinguishing absorptions in the IR. Match each structure with its characteristic absorption.

(a) sharp, 2254 cm–1

(b) very broad, centered about 3330 cm–1

(c) strong, slightly broadened, 1645 cm–1

(d) broad with spikes at 3367 and 3292 cm–1

(e) strong, sharp 1717 cm–1

1464
views
교과서 질문

The ultimate test of fluency in MS and IR is whether you can determine a moderately complex structure from just the MS and the IR, with no additional information. The IR and MS of a compound are shown below. Use everything you know about IR and MS, plus reasoning and intuition, to determine a likely structure. Then show how your proposed structure is consistent with these spectra.

<IMAGES>

1237
views
교과서 질문

A laboratory student added 1-bromobutane to a flask containing dry ether and magnesium turnings. An exothermic reaction resulted, and the ether boiled vigorously for several minutes. Then she added acetone to the reaction mixture and the ether boiled even more vigorously. She added dilute acid to the mixture and separated the layers. She evaporated the ether layer, and distilled a liquid that boiled at 143 °C. GC–MS analysis of the distillate showed one major product with a few minor impurities. The mass spectrum of the major product is shown here.

(a) Draw out the reactions that took place and show the product that was formed.

<IMAGE>

1405
views
교과서 질문

Consider the following four structures, followed by mass spectral data. Match each structure with its characteristic molecular ion or fragment. In each case, give a likely structure of the ion responsible for the base peak.

(a) base peak at 105

(b) base peak at 72

(c) M+ doublet at 198 and 200, base peak at 91

(d) base peak at 91, large peak at 43

1466
views
교과서 질문

A laboratory student added 1-bromobutane to a flask containing dry ether and magnesium turnings. An exothermic reaction resulted, and the ether boiled vigorously for several minutes. Then she added acetone to the reaction mixture and the ether boiled even more vigorously. She added dilute acid to the mixture and separated the layers. She evaporated the ether layer, and distilled a liquid that boiled at 143 °C. GC–MS analysis of the distillate showed one major product with a few minor impurities. The mass spectrum of the major product is shown here.

(b) Explain why the molecular ion is or is not visible in the mass spectrum, and show what ions are likely to be responsible for the strong peaks at m/z 59 and 101.

<IMAGE>

1399
views
교과서 질문

A C-D (carbon–deuterium) bond is electronically much like a C-H bond, and it has a similar stiffness, measured by the spring constant, k. The deuterium atom has twice the mass (m) of a hydrogen atom, however.

(a) The infrared absorption frequency is approximately proportional to km\(\sqrt{\frac{k}{m}\)} , when one of the bonded atoms is much heavier than the other, and m is the lighter of the two atoms (H or D in this case). Use this relationship to calculate the IR absorption frequency of a typical C-D bond. Use 3000 cm–1 as a typical C-H absorption frequency.

(b) A chemist dissolves a sample in deuterochloroform (CDCl3) and then decides to take the IR spectrum and simply evaporates most of the CDCl3. What functional group will appear to be present in this IR spectrum as a result of the CDCl3 impurity?
2580
views