Ch. 10 - Chi-Square Tests and the F-Distribution
Larson - Elementary Statistics: Picturing the World 8th Edition
Larson8th EditionElementary Statistics: Picturing the WorldISBN: 9780137493470Not the one you use?Change textbook
Chapter 10, Problem 10.1.17

Testing for Normality Using a chi-square goodness-of-fit test, you can decide, with some degree of certainty, whether a variable is normally distributed. In all chi-square tests for normality, the null and alternative hypotheses are as listed below.


H₀: The variable has a normal distribution.


Hₐ: The variable does not have a normal distribution.


To determine the expected frequencies when performing a chi-square test for normality, first estimate the mean and standard deviation of the frequency distribution. Then, use the mean and standard deviation to compute the z-score for each class boundary. Then, use the z-scores to calculate the area under the standard normal curve for each class. Multiplying the resulting class areas by the sample size yields the expected frequency for each class.In Exercises 17 and 18, (a) find the expected frequencies, (b) find the critical value and identify the rejection region, (c) find the chi-square test statistic, (d) decide whether to reject or fail to reject the null hypothesis, and (e) interpret the decision in the context of the original claim.


In Exercises 17 and 18, (a) find the expected frequencies, (b) find the critical value and identify the rejection region, (c) find the chi-square test statistic, (d) decide whether to reject or fail to reject the null hypothesis, and (e) interpret the decision in the context of the original claim.


Test Scores At α=0.01, test the claim that the 200 test scores shown in the frequency distribution are normally distributed.


Verified step by step guidance
1
Step 1: Calculate the sample mean (\( \bar{x} \)) and sample standard deviation (\( s \)) using the midpoints of each class interval and their corresponding frequencies. The midpoint for each class is the average of the class boundaries. Use the formulas: \( \bar{x} = \frac{\sum f x}{n} \) and \( s = \sqrt{\frac{\sum f (x - \bar{x})^2}{n - 1}} \), where \( x \) is the midpoint and \( f \) is the frequency.
Step 2: Convert the class boundaries to z-scores using the formula \( z = \frac{x - \bar{x}}{s} \) for each boundary. This standardizes the class boundaries relative to the estimated normal distribution.
Step 3: Use the z-scores to find the area under the standard normal curve for each class interval. This is done by finding the cumulative probabilities for the z-scores at the boundaries and subtracting to get the area for each class.
Step 4: Multiply each class area by the total sample size (\( n = 200 \)) to find the expected frequencies for each class. These expected frequencies represent the counts we would expect if the data were normally distributed.
Step 5: Perform the chi-square goodness-of-fit test by calculating the test statistic \( \chi^2 = \sum \frac{(f - E)^2}{E} \), where \( f \) is the observed frequency and \( E \) is the expected frequency for each class. Then, determine the degrees of freedom (number of classes minus 1 minus the number of estimated parameters, usually 2 for mean and standard deviation), find the critical value from the chi-square distribution table at \( \alpha = 0.01 \), and compare the test statistic to the critical value to decide whether to reject or fail to reject the null hypothesis.

Verified video answer for a similar problem:

This video solution was recommended by our tutors as helpful for the problem above.
Video duration:
3m
Was this helpful?

Key Concepts

Here are the essential concepts you must grasp in order to answer the question correctly.

Chi-Square Goodness-of-Fit Test

The chi-square goodness-of-fit test assesses whether observed frequency data fit a specific distribution, such as the normal distribution. It compares observed frequencies with expected frequencies calculated under the null hypothesis. The test statistic sums the squared differences between observed and expected frequencies, divided by expected frequencies.
Recommended video:
Guided course
10:17
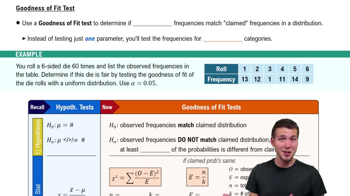
Goodness of Fit Test

Calculating Expected Frequencies Using the Normal Distribution

To find expected frequencies for each class, estimate the mean and standard deviation from the data. Convert class boundaries to z-scores, then find the area under the standard normal curve between these z-scores. Multiply these areas by the total sample size to get expected frequencies for each class.
Recommended video:
Guided course
06:38
Intro to Frequency Distributions

Hypothesis Testing and Decision Making

In hypothesis testing, the null hypothesis (H₀) assumes the data follow a normal distribution, while the alternative (Hₐ) assumes they do not. Using the chi-square statistic and critical value at a chosen significance level (α=0.01), decide to reject or fail to reject H₀. This decision interprets whether the data support normality.
Recommended video:
05:52
Performing Hypothesis Tests: Proportions
Related Practice
Textbook Question

Explain how to find the critical value for an F-test.

448
views

Textbook Question

"Finding a Critical F-Value for a Right-Tailed Test In Exercises 5–8, find the critical F-value for a right-tailed test using the level of significance α and degrees of freedom d.f.N and d.f.D.


α=0.05, d.f.N=9, d.f.D=16"

77
views
Textbook Question

Conditional Relative Frequencies In Exercises 37–42, use the contingency table from Exercises 33–36, and the information below.

Relative frequencies can also be calculated based on the row totals (by dividing each row entry by the row’s total) or the column totals (by dividing each column entry by the column’s total). These frequencies are conditional relative frequencies and can be used to determine whether an association exists between two categories in a contingency table.


What percent of U.S. adults ages 25 and over who are not high school graduates are unemployed?

80
views
Textbook Question

"Finding a Critical F-Value for a Right-Tailed Test In Exercises 5–8, find the critical F-value for a right-tailed test using the level of significance α and degrees of freedom d.f.N and d.f.D.


α=0.01, d.f.N=2, d.f.D=11"

49
views
Textbook Question

True or False? In Exercises 5 and 6, determine whether the statement is true or false. If it is false, rewrite it as a true statement.


When the test statistic for the chi-square independence test is large, you will, in most cases, reject the null hypothesis.

69
views
Textbook Question

"In Exercises 13–18, test the claim about the difference between two population variances σ₁² and σ₂² at the level of significance α. Assume the samples are random and independent, and the populations are normally distributed.


Claim: σ₁² = σ₂²; α = 0.05.

Sample statistics: s₁² = 310, n₁ = 7 and s₂² = 297, n₂ = 8"

64
views