


Ch. 9 - Correlation and Regression
Larson - Elementary Statistics: Picturing the World 8th Edition
Larson8th EditionElementary Statistics: Picturing the WorldISBN: 9780137493470Not the one you use?Change textbook
Chapter 9, Problem 9.T.7

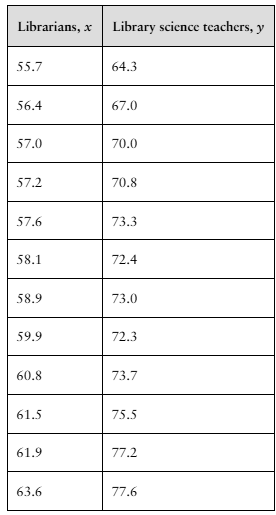
"[APPLET] For Exercises 2–9, use the data in the table, which shows the average annual salaries (both in thousands of dollars) for librarians and postsecondary library science teachers in the United States for 12 years. (Source: U.S. Bureau of Labor Statistics)

7. Find the coefficient of determination r^2 and interpret the result."

Verified step by step guidance
1
Step 1: Understand that the coefficient of determination, denoted as r², measures the proportion of the variance in the dependent variable (library science teachers' salaries, y) that is predictable from the independent variable (librarians' salaries, x).
Step 2: Calculate the correlation coefficient r between x and y. This involves finding the covariance of x and y, and dividing it by the product of their standard deviations. The formula is: r = \(\frac{\text{cov}\)(x,y)}{s_x s_y}.
Step 3: To find covariance, calculate the mean of x and y, then compute the average product of their deviations from their means: \(\text{cov}\)(x,y) = \(\frac{1}{n}\) \(\sum\)_{i=1}^n (x_i - \(\bar{x}\))(y_i - \(\bar{y}\)).
Step 4: Calculate the standard deviations of x and y using: s_x = \(\sqrt{\frac{1}{n}\) \(\sum\)_{i=1}^n (x_i - \(\bar{x}\))^2} and similarly for s_y.
Step 5: Square the correlation coefficient r to get r², the coefficient of determination. Interpret r² as the percentage of variation in y explained by x.

Verified video answer for a similar problem:

This video solution was recommended by our tutors as helpful for the problem above.
Video duration:
2m
Was this helpful?

Key Concepts

Here are the essential concepts you must grasp in order to answer the question correctly.

Coefficient of Determination (r²)

The coefficient of determination, denoted as r², measures the proportion of the variance in the dependent variable that is predictable from the independent variable. It ranges from 0 to 1, where a higher value indicates a better fit of the regression model to the data. For example, an r² of 0.85 means 85% of the variation in salaries of library science teachers can be explained by the salaries of librarians.
Recommended video:
Guided course
06:14
Coefficient of Determination

Linear Regression and Correlation

Linear regression models the relationship between two variables by fitting a line that minimizes the sum of squared differences between observed and predicted values. Correlation measures the strength and direction of a linear relationship between variables, ranging from -1 to 1. The coefficient of determination is the square of the correlation coefficient, linking these concepts closely.
Recommended video:
Guided course
07:01
Intro to Least Squares Regression

Interpreting Statistical Results in Context

Interpreting r² involves understanding what the value means in the context of the data. It helps assess how well one variable explains another, but does not imply causation. In this case, interpreting r² helps determine how well librarian salaries predict library science teacher salaries, guiding decisions or insights about their relationship.
Recommended video:
07:10
Empirical Rule of Standard Deviation and Range Rule of Thumb
Related Practice
Textbook Question

"Finding the Coefficient of Determination and the Standard Error of Estimate In Exercises 11-20, use the data to (a) find the coefficient of determination r^2 and interpret the result,

12. [APPLET] Median and Mean Hourly Wages The table shows the median and mean hourly wages (in dollars) in 10 states in a recent year. The equation of the regression line is y = 1.208x + 1.495. (Source: U.S. Census Bureau)

"

163
views
Textbook Question

Writing Use an appropriate research source to find a real-life data set with the indicated cause-and-effect relationship. Write a paragraph describing each variable and explain why you think the variables have the indicated cause-and-effect relationship.

a. Direct Cause-and-Effect: Changes in one variable cause changes in the other variable.

74
views
Textbook Question

"[APPLET] For Exercises 2–9, use the data in the table, which shows the average annual salaries (both in thousands of dollars) for librarians and postsecondary library science teachers in the United States for 12 years. (Source: U.S. Bureau of Labor Statistics)

8. Find the standard error of estimate Se and interpret the result."

66
views
Textbook Question

"The U.S. Food and Drug Administration (FDA) requires nutrition labeling for most foods. Un FDA regulations, manufacturers are required to list the amounts of certain nutrients in their foods, such as calories, sugar, fat, and carbohydrates. This nutritional information is displayed in the ""Nutrition Facts"" panel on the food's package.

The table shows the nutritional content below for one cup of each of 21 different breakfast

cereals.

C = calories

S = sugar in grams

F = fat in grams

R = carbohydrates in grams

7. Use the equations from Exercise 6 to predict the calories in 1 cup of cereal that has 7 grams of sugar, 0.5 gram of fat, and 31 grams of carbohydrates."

50
views
Textbook Question

"[APPLET] For Exercises 2–9, use the data in the table, which shows the average annual salaries (both in thousands of dollars) for librarians and postsecondary library science teachers in the United States for 12 years. (Source: U.S. Bureau of Labor Statistics)

6. Use the regression equation that you found in Exercise 5 to predict the average annual salary of postsecondary library science teachers when the average annual salary of librarians is \$61,000."

49
views
Textbook Question

"1. Net Sales The equation used to predict the net sales (in millions of dollars) for a fiscal

year for a clothing retailer is y=23,769 + 9.18x_1 - 8.41x_2

where x_1 is the number of stores open at the end of the fiscal year and x_2 is the average

square footage per store. Use the multiple regression equation to predict the y-values for

the values of the independent variables.

a. x_1 = 1057, x_2 = 3698

b. x_1 = 1012, x_2 = 3659

c. x_1 = 952, x_2 = 3601

d. x_1 = 914, x_2 = 3594"

42
views