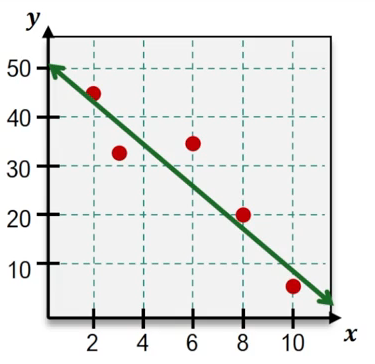
Scatter plots are a powerful tool for visualizing the relationship between two variables, typically represented as x and y values on a graph. By examining these plots, one can identify patterns and trends, such as positive or negative correlations. A positive correlation indicates that as one variable increases, the other does as well. To quantify this relationship, we can use a method known as least squares regression, which helps us find the best fit line through the data points.
Least squares regression is a statistical technique that minimizes the sum of the squares of the residuals, which are the vertical distances from each data point to the line. The goal is to find a linear equation of the form y = ax + b, where a represents the slope and b is the y-intercept. The smaller the residuals, the better the fit of the line to the data points.
To perform least squares regression using a graphing calculator, follow these steps:
- Enable the Diagnostic On feature in your calculator to access statistical functions.
- Input your data into the calculator, designating one list for x values and another for y values.
- Activate the stat plot feature to visualize your data points on the graph.
- Navigate to the stat menu, select the linear regression option, and specify the lists for x and y data. The calculator will compute the best fit line and provide the values for a and b.
- Record the equation of the line, which will be in the form ŷ = ax + b, where ŷ denotes the predicted values.
- Finally, input the equation into the graphing function of your calculator to visualize the best fit line alongside your data points.
For example, if you analyze ice cream sales against daily high temperatures, you might find a positive correlation where higher temperatures lead to increased sales. By applying least squares regression, you can derive a precise equation that models this relationship, allowing for predictions and deeper insights into the data.
Understanding least squares regression not only enhances your ability to interpret data but also equips you with the skills to make informed predictions based on observed trends. This method is widely applicable across various fields, including economics, biology, and social sciences, making it a valuable tool in data analysis.


