This is a sample practice set. In order to have a more personalized exam prep experience:
or
3. Describing Data Numerically / Percentiles & Quartiles / Problem 18
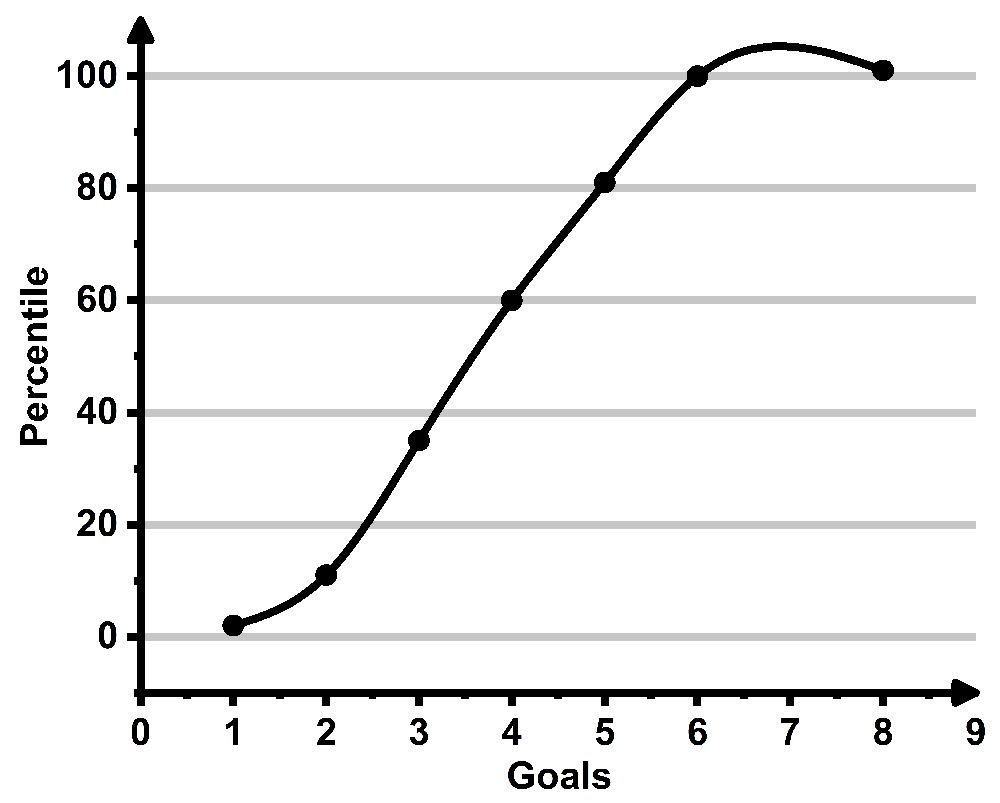
Problem 18
The goals scored by the winning teams in a football tournament final are represented in the ogive below. What score represents the th percentile? What interpretation could be drawn from this?