


Ch. 9 - Correlation and Regression
Larson - Elementary Statistics: Picturing the World 8th Edition
Larson8th EditionElementary Statistics: Picturing the WorldISBN: 9780137493470Not the one you use?Change textbook
Chapter 9, Problem 9.3.30

"Constructing and Interpreting a Prediction Interval In Exercises 21-30, construct the indicated prediction interval and interpret the results.
30. New Vehicle Sales Construct a 99% prediction interval for new vehicle sales for Honda in Exercise 20 when the number of new vehicles sold by Toyota is 2159 thousand."

Verified step by step guidance
1
Identify the regression equation from Exercise 20, which relates the number of new vehicles sold by Toyota (independent variable, x) to the number of new vehicles sold by Honda (dependent variable, y). This equation typically has the form: \(\hat{y}\) = b_0 + b_1x, where b_0 is the intercept and b_1 is the slope.
Calculate the predicted value \(\hat{y}\) for Honda vehicle sales when Toyota sales are 2159 thousand by substituting x = 2159 into the regression equation.
Determine the standard error of the prediction, which accounts for both the variability of the estimate of the mean response and the variability of individual observations. The formula for the standard error of prediction at a specific x is: SE_{pred} = s \(\sqrt{1 + \frac{1}{n}\) + \(\frac{(x - \bar{x}\))^2}{\(\sum\) (x_i - \(\bar{x}\))^2}}, where s is the standard error of the estimate, n is the sample size, \(\bar{x}\) is the mean of the x values, and x_i are the observed x values.
Find the critical t-value for a 99% prediction interval with degrees of freedom equal to n - 2. This value comes from the t-distribution table and reflects the desired confidence level.
Construct the 99% prediction interval using the formula: \(\hat{y}\) \(\pm\) t_{\(\alpha\)/2, n-2} \(\times\) SE_{pred}. Interpret this interval as the range in which we expect the actual number of Honda vehicle sales to fall with 99% confidence when Toyota sales are 2159 thousand.

Verified video answer for a similar problem:

This video solution was recommended by our tutors as helpful for the problem above.
Video duration:
3m
Was this helpful?

Key Concepts

Here are the essential concepts you must grasp in order to answer the question correctly.

Prediction Interval

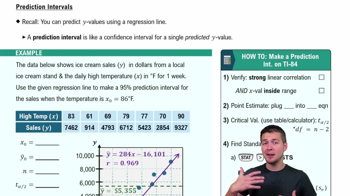
A prediction interval estimates the range within which a single future observation is expected to fall, with a specified level of confidence. Unlike confidence intervals for mean responses, prediction intervals account for both the uncertainty in estimating the mean and the variability of individual outcomes.
Recommended video:
Guided course
09:00
Prediction Intervals

Confidence Level

The confidence level, such as 99%, indicates the probability that the prediction interval contains the true future value. A higher confidence level results in a wider interval, reflecting greater certainty that the interval captures the future observation.
Recommended video:
06:33
Introduction to Confidence Intervals

Regression and Using Predictor Variables

Prediction intervals often rely on regression models that relate a dependent variable to one or more predictors. Here, the number of new vehicles sold by Toyota is the predictor used to estimate Honda's sales, and the interval incorporates the variability around this regression estimate.
Recommended video:
Guided course
04:57
Using Regression Lines to Predict Values
Related Practice
Textbook Question

"Constructing and Interpreting a Prediction Interval In Exercises 21-30, construct the indicated prediction interval and interpret the results.

29. New Vehicle Sales Construct a 95% prediction interval for new vehicle sales for General Motors in Exercise 19 when the number of new vehicles sold by Ford is 2028 thousand."

66
views
Textbook Question

Graphical Analysis In Exercises 11–14, determine whether there is a perfect positive linear correlation, a strong positive linear correlation, a perfect negative linear correlation, a strong negative linear correlation, or no linear correlation between the variables.

54
views
Textbook Question

"Constructing and Interpreting a Prediction Interval In Exercises 21-30, construct the indicated prediction interval and interpret the results.

28. Total Assets Construct a 90% prediction interval for the total assets in federal defined benefit plans in Exercise 18 when the total assets in IRAs are \$6400 billion."

60
views
Textbook Question

"In Exercises 9 and 10, identify the explanatory variable and the response variable.

10. An actuary at an insurance company wants to determine whether the number of hours of safety driving classes can be used to predict the number of driving accidents for each

driver."

102
views
Textbook Question

Graphical Analysis In Exercises 11–14, determine whether there is a perfect positive linear correlation, a strong positive linear correlation, a perfect negative linear correlation, a strong negative linear correlation, or no linear correlation between the variables.

46
views
Textbook Question

"Constructing and Interpreting a Prediction Interval In Exercises 21-30, construct the indicated prediction interval and interpret the results.

22. Mean Hourly Wage Construct a 95% prediction interval for the mean hourly wage in Exercise 12 when the median hourly wage is \$21.50."

53
views