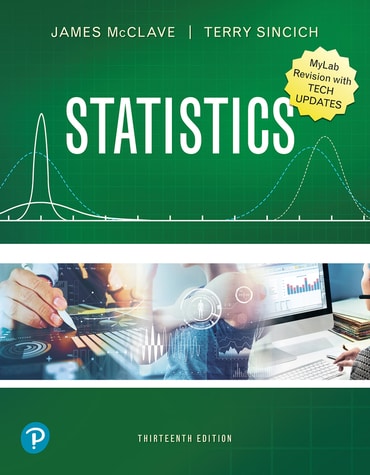
Statistics, Updated Edition, 13th edition

Published by Pearson (January 2, 2020) © 2021

  • James T. McClave University of Florida
  • Terry T Sincich University of South Florida

eTextbook

per month

  • Anytime, anywhere learning with the Pearson+ app
  • Easy-to-use search, navigation and notebook
  • Simpler studying with flashcards
$79.99

  • Hardcover, paperback or looseleaf edition
  • Affordable rental option for select titles
  • Free shipping on looseleafs and traditional textbooks

MyLab

from$99.99

  • Reach every student with personalized support
  • Customize courses with ease
  • Optimize learning with dynamic study tools

For courses in Introductory Statistics.

A contemporary classic 

Statistics, 13th Edition is a trusted and comprehensive introduction to statistics that emphasizes inference and integrates real data throughout. McClave and Sincich emphasize the development of statistical thinking, the assessment of credibility, and value of the inferences made from data. Ideal for 1- or 2-semester courses, it assumes a mathematical background of basic algebra. Flexibility is built in for instructors who teach a more advanced course, with optional footnotes about calculus and the underlying theory. The print book has been reprinted with new and updated statistical software screenshots. 

Hallmark features of this title

  • Where We're Going bullets begin each chapter, with learning objectives and section numbers corresponding to concept coverage.
  • Examples build problem-solving skills with a 3-step approach: Problem, Solution, and Look Back (or Look Ahead). Look Back gives helpful hints for solving the problem and/or provides a further reflection or insight into the concept or procedure that is covered.
  • A Now Work exercise suggestion follows each Example, which provides a practice exercise that is similar in style and concept to the example.
  • More than 2,000 exercises are included, based on a wide variety of applications in various disciplines and research areas.
  • Case studies, applications and biographies keep students motivated and show the relevance of statistics.

New and updated features of this title

  • Updated statistical software screenshots appear throughout the printed version of this revision.
  • 25% of the 2,000+ exercises are updated or new, based on contemporary studies and real data. Most of these exercises foster and promote critical thinking skills. 
  • Updated technology: all printouts from statistical software (SAS, SPSS, MINITAB, and the TI-83/Tl-84 Plus Graphing Calculator) and corresponding instructions for use have been revised to reflect the latest versions of the software.
  • Continued emphasis on Ethics: where appropriate, in-text boxes emphasize the importance of ethical behavior when collecting, analyzing, and interpreting data with statistics.

Highlights of the DIGITAL UPDATE for MyLab Statistics

Instructors, contact your sales rep to ensure you have the most recent version of the course. 

  • Increases coverage of the end-of-section exercises throughout the book
  • Adds 22 brand-new, author created videos that further explore section topics and real-world case studies

Features of MyLab Statistics for the 13th Edition

  • 25% new and updated exercises give students more of the practice they need to succeed.
  • StatCrunch® applets have been updated to run in HTML5, so that they are more accessible and will run on most computers and tablets without additional plugins.
  • Data-informed updates: the authors have analyzed aggregated student usage and performance data from the previous edition's MyLab Statistics course. The results of this analysis helped improved the quality and quantity of exercises that matter most to instructors and students.

1. Statistics, Data, and Statistical Thinking

  • 1.1 The Science of Statistics
  • 1.2 Types of Statistical Applications
  • 1.3 Fundamental Elements of Statistics
  • 1.4 Types of Data
  • 1.5 Collecting Data: Sampling and Related Issues
  • 1.6 The Role of Statistics in Critical Thinking and Ethics

2. Methods for Describing Sets of Data

  • 2.1 Describing Qualitative Data
  • 2.2 Graphical Methods for Describing Quantitative Data
  • 2.3 Numerical Measures of Central Tendency
  • 2.4 Numerical Measures of Variability
  • 2.5 Using the Mean and Standard Deviation to Describe Data
  • 2.6 Numerical Measures of Relative Standing
  • 2.7 Methods for Detecting Outliers: Box Plots and z-Scores
  • 2.8 Graphing Bivariate Relationships (Optional)
  • 2.9 Distorting the Truth with Descriptive Statistics

3. Probability

  • 3.1 Events, Sample Spaces, and Probability
  • 3.2 Unions and Intersections
  • 3.3 Complementary Events
  • 3.4 The Additive Rule and Mutually Exclusive Events
  • 3.5 Conditional Probability
  • 3.6 The Multiplicative Rule and Independent Events
  • 3.7 Some Additional Counting Rules (Optional)
  • 3.8 Bayes's Rule (Optional)

4. Discrete Random Variables

  • 4.1 Two Types of Random Variables
  • 4.2 Probability Distributions for Discrete Random Variables
  • 4.3 Expected Values of Discrete Random Variables
  • 4.4 The Binomial Random Variable
  • 4.5 The Poisson Random Variable (Optional)
  • 4.6 The Hypergeometric Random Variable (Optional)

5. Continuous Random Variables

  • 5.1 Continuous Probability Distributions
  • 5.2 The Uniform Distribution
  • 5.3 The Normal Distribution
  • 5.4 Descriptive Methods for Assessing Normality
  • 5.5 Approximating a Binomial Distribution with a Normal Distribution (Optional)
  • 5.6 The Exponential Distribution (Optional)

6. Sampling Distributions

  • 6.1 The Concept of a Sampling Distribution
  • 6.2 Properties of Sampling Distributions: Unbiasedness and Minimum Variance
  • 6.3 The Sampling Distribution of (x-bar) and the Central Limit Theorem
  • 6.4 The Sampling Distribution of the Sample Proportion

7. Inferences Based on a Single Sample: Estimation with Confidence Intervals

  • 7.1 Identifying and Estimating the Target Parameter
  • 7.2 Confidence Interval for a Population Mean: Normal (z) Statistic
  • 7.3 Confidence Interval for a Population Mean: Student's t-Statistic
  • 7.4 Large-Sample Confidence Interval for a Population Proportion
  • 7.5 Determining the Sample Size
  • 7.6 Confidence Interval for a Population Variance (Optional)

8. Inferences Based on a Single Sample: Tests of Hypothesis

  • 8.1 The Elements of a Test of Hypothesis
  • 8.2 Formulating Hypotheses and Setting Up the Rejection Region
  • 8.3 Observed Significance Levels: p-Values
  • 8.4 Test of Hypothesis about a Population Mean: Normal (z) Statistic
  • 8.5 Test of Hypothesis about a Population Mean: Student's t-Statistic
  • 8.6 Large-Sample Test of Hypothesis about a Population Proportion
  • 8.7 Calculating Type II Error Probabilities: More about β (Optional)
  • 8.8 Test of Hypothesis about a Population Variance (Optional)

9. Inferences Based on Two Samples: Confidence Intervals and Tests of Hypotheses

  • 9.1 Identifying the Target Parameter
  • 9.2 Comparing Two Population Means: Independent Sampling
  • 9.3 Comparing Two Population Means: Paired Difference Experiments
  • 9.4 Comparing Two Population Proportions: Independent Sampling
  • 9.5 Determining the Sample Size
  • 9.6 Comparing Two Population Variances: Independent Sampling (Optional)

10. Analysis of Variance: Comparing More than Two Means

  • 10.1 Elements of a Designed Study
  • 10.2 The Completely Randomized Design: Single Factor
  • 10.3 Multiple Comparisons of Means
  • 10.4 The Randomized Block Design
  • 10.5 Factorial Experiments: Two Factors

11. Simple Linear Regression

  • 11.1 Probabilistic Models
  • 11.2 Fitting the Model: The Least Squares Approach
  • 11.3 Model Assumptions
  • 11.4 Assessing the Utility of the Model: Making Inferences about the Slope β1
  • 11.5 The Coefficients of Correlation and Determination
  • 11.6 Using the Model for Estimation and Prediction
  • 11.7 A Complete Example

12. Multiple Regression and Model Building

  • 12.1 Multiple-Regression Models
  • PART I: First-Order Models with Quantitative Independent Variables
  • 12.2 Estimating and Making Inferences about the β Parameters
  • 12.3 Evaluating Overall Model Utility
  • 12.4 Using the Model for Estimation and Prediction
  • PART II: Model Building in Multiple Regression
  • 12.5 Interaction Models
  • 12.6 Quadratic and Other Higher Order Models
  • 12.7 Qualitative (Dummy) Variable Models
  • 12.8 Models with Both Quantitative and Qualitative Variables (Optional)
  • 12.9 Comparing Nested Models (Optional)
  • 12.10 Stepwise Regression (Optional)
  • PART III: Multiple Regression Diagnostics
  • 12.11 Residual Analysis: Checking the Regression Assumptions
  • 12.12 Some Pitfalls: Estimability, Multicollinearity, and Extrapolation

13. Categorical Data Analysis

  • 13.1 Categorical Data and the Multinomial Experiment
  • 13.2 Testing Categorical Probabilities: One-Way Table
  • 13.3 Testing Categorical Probabilities: Two-Way (Contingency) Table
  • 13.4 A Word of Caution about Chi-Square Tests

14. Nonparametric Statistics (available online)

  • 14.1 Introduction: Distribution-Free Tests
  • 14.2 Single-Population Inferences
  • 14.3 Comparing Two Populations: Independent Samples
  • 14.4 Comparing Two Populations: Paired Difference Experiment
  • 14.5 Comparing Three or More Populations: Completely Randomized Design
  • 14.6 Comparing Three or More Populations: Randomized Block Design
  • 14.7 Rank Correlation

APPENDICES

  • A. Summation Notation
  • B. Tables
  • C. Calculation Formulas for Analysis of Variance
  • Short Answers to Selected Odd-Numbered Exercises

    Index

About our authors

Dr. Jim McClave is currently President and CEO of Info Tech, Inc., a statistical consulting and software development firm with an international clientele. He is also currently an Adjunct Professor of Statistics at the University of Florida, where he was a full-time member of the faculty for 20 years.

Dr. Terry Sincich obtained his PhD in Statistics from the University of Florida in 1980. He is an Associate Professor in the Information Systems & Decision Sciences Department at the University of South Florida in Tampa. Dr. Sincich is responsible for teaching basic statistics to all undergraduates, as well as advanced statistics to all doctoral candidates, in the College of Business Administration. He has published articles in such journals as the Journal of the American Statistical Association, International Journal of Forecasting, Academy of Management Journal, and Auditing: A Journal of Practice & Theory. Dr. Sincich is a co-author of the texts Statistics, Statistics for Business & Economics, Statistics for Engineering & the Sciences,  and A Second Course in Statistics: Regression Analysis.

Need help? Get in touch

MyLab

Customize your course to teach your way. MyLab® is a flexible platform merging world-class content with dynamic study tools. It takes a personalized approach designed to ignite each student's unique potential. And, with the freedom it affords to adapt your pedagogy, you can reinforce select concepts and guide students to real results.
Pearson+

All in one place. Pearson+ offers instant access to eTextbooks, videos and study tools in one intuitive interface. Students choose how they learn best with enhanced search, audio and flashcards. The Pearson+ app lets them read where life takes them, no wi-fi needed. Students can access Pearson+ through a subscription or their MyLab or Mastering course.