
Ch. 2 - Exploring Data with Tables and Graphs
Triola - Elementary Statistics 14th Edition
Triola14th EditionElementary StatisticsISBN: 9780137366446Not the one you use?Change textbook
Chapter 2, Problem 2.1.14

Presidents Listed below are the ages (years) of presidents of the United States at the times of their first inaugurations (from Data Set 22 “Presidents” in Appendix B). Presidents who took office as a result of an assassination or resignation are not included. The data are current as of this writing. Use these ages to construct a frequency distribution. Use a class width of 5 years and begin with a lower class limit of 40 years. Do the ages appear to have a normal distribution?
A list of ages of U.S. presidents at their first inaugurations, ranging from 42 to 70 years.

Verified step by step guidance
1
Step 1: Organize the data by listing the ages of the presidents at their first inauguration. The ages provided are: 57, 61, 57, 57, 61, 64, 48, 49, 64, 52, 46, 49, 47, 55, 42, 51, 56, 51, 54, 60, 62, 43, 55, 56, 52, 69, 46, 54, 47, 70.
Step 2: Determine the range of the data by identifying the minimum and maximum ages. The minimum age is 42 and the maximum age is 70.
Step 3: Create the class intervals for the frequency distribution. Start with a lower class limit of 40 years and use a class width of 5 years. The classes will be: 40-44, 45-49, 50-54, 55-59, 60-64, 65-69, and 70-74.
Step 4: Count the number of ages that fall into each class interval to construct the frequency distribution. For example, count how many ages fall between 40 and 44, then 45 and 49, and so on.
Step 5: Analyze the frequency distribution to determine if the ages appear to have a normal distribution. A normal distribution typically has a bell-shaped curve, so check if the frequencies increase to a peak and then decrease symmetrically.

Verified video answer for a similar problem:

This video solution was recommended by our tutors as helpful for the problem above.
Video duration:
4m

Key Concepts

Here are the essential concepts you must grasp in order to answer the question correctly.

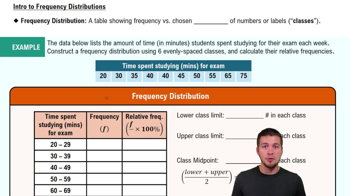
Frequency Distribution

A frequency distribution is a summary of how often each value occurs in a dataset. It organizes data into classes or intervals, allowing for easier analysis of patterns and trends. In this case, the ages of U.S. presidents will be grouped into intervals of 5 years, starting from 40, to visualize the distribution of ages at inauguration.
Recommended video:
Guided course
06:38
Intro to Frequency Distributions

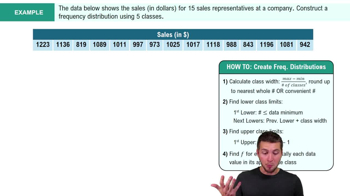
Class Width

Class width refers to the range of values that each class in a frequency distribution covers. It is calculated by subtracting the lower limit of a class from its upper limit. For this question, a class width of 5 years means that each age group will encompass a range of 5 years, such as 40-44, 45-49, and so on, facilitating the organization of the data.
Recommended video:
Guided course
05:18
How to Create Frequency Distributions Example 2

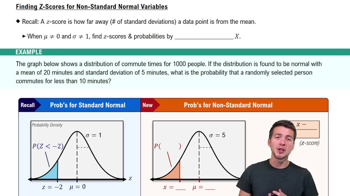
Normal Distribution

A normal distribution is a probability distribution that is symmetric about the mean, showing that data near the mean are more frequent in occurrence than data far from the mean. To determine if the ages of presidents exhibit a normal distribution, one would analyze the frequency distribution for symmetry and the presence of a bell-shaped curve, indicating that most ages cluster around the average.
Recommended video:
Guided course
03:17
Finding Z-Scores for Non-Standard Normal Variables
Related Practice
Textbook Question

In Exercises 9–18, construct the histograms and answer the given questions.


Burger King Dinner Service Times Use the frequency distribution from Exercise 18 in Section 2-1 to construct a histogram. Using a strict interpretation of the criteria for being a normal distribution, does the histogram appear to depict data from a population with a normal distribution?

188
views
Textbook Question

In Exercises 11 and 12 construct the Pareto chart.


Box Office Boffo Recent annual gross revenue (millions of dollars) for the leading movie studios are as follows: 20th Century Fox (1082), Buena Vista (3092), Paramount (757), Sony/Columbia (1304), Universal (1772), Warner Brothers (1941). Are these data likely to be reasonably accurate?

155
views
Textbook Question

Hershey Kisses Refer to Data Set 38 “Candies” and use the weights (grams) of Hershey’s Kisses. Begin with a lower class limit of 4.300 g and use a class width of 0.100 g. Does this distribution appear to be a normal distribution?

144
views
Textbook Question

Exercises 29–34 involve large sets of data, so technology should be used. Complete lists of the data are not listed in Appendix B, but they can be downloaded from the website TriolaStats.com. Use the indicated data and construct the frequency distribution.


Diastolic Blood Pressure Use the diastolic blood pressures of the 300 subjects included in Data Set 1 “Body Data.” Use a class width of 15 mm Hg and begin with a lower class limit of 40 mm Hg. Does the frequency distribution appear to be a normal distribution?

160
views
Textbook Question

In Exercises 5 and 6, construct the dotplot.


Pulse Rates Listed below are pulse rates (beats per minute) of females selected from Data Set 1 “Body Data” in Appendix B. All of those pulse rates are even numbers. Is there a pulse rate that appears to be an outlier? What is its value?


142
views
Textbook Question

In Exercises 25 and 26, construct the cumulative frequency distribution that corresponds to the frequency distribution in the exercise indicated.


Exercise 5 (Age of Best Actress When Oscar Was Won)

202
views