This is a sample practice set. In order to have a more personalized exam prep experience:
or
9. Hypothesis Testing for One Sample / Steps in Hypothesis Testing / Problem 3
Problem 3
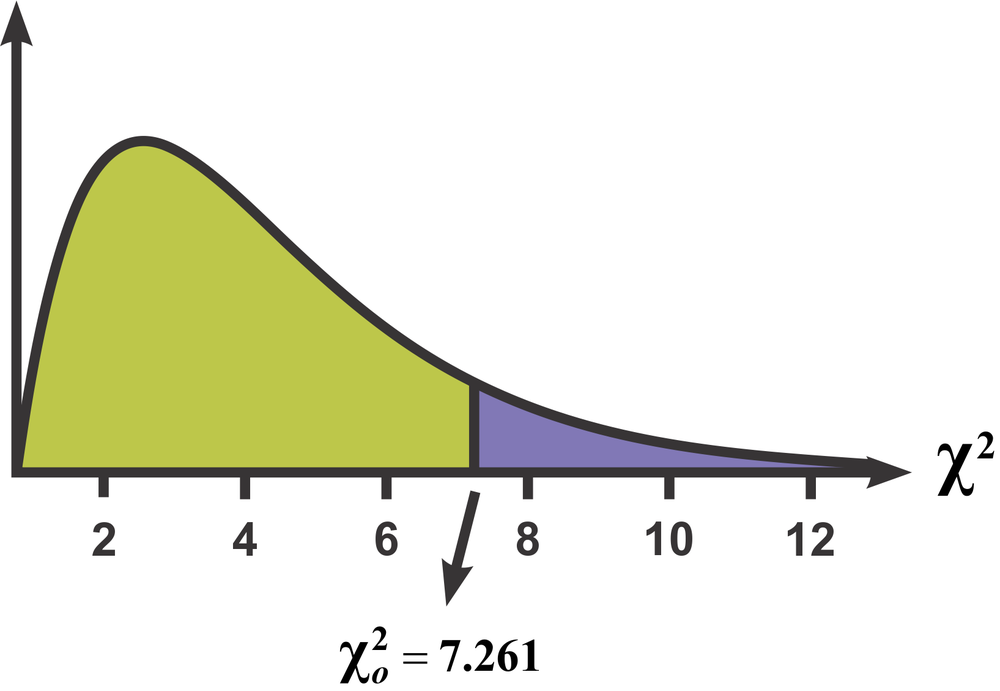
A chi-square test produces a test statistic of . Should you reject the null hypothesis based on the graph given below? Note: The purple area indicates the rejection region.