Skip to main content
Trigonometry
My Course
Learn
Exam Prep
AI Tutor
Study Guides
Textbook Solutions
Flashcards
Explore
Try the app
My Course
Learn
Exam Prep
AI Tutor
Study Guides
Textbook Solutions
Flashcards
Explore
Try the app
Back
Basics of Graphing definitions
You can tap to flip the card.
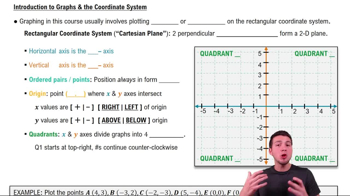
Rectangular Coordinate System
You can tap to flip the card.
👆
Rectangular Coordinate System
A two-dimensional grid formed by intersecting perpendicular number lines, used to plot locations with two values.
Track progress
Control buttons has been changed to "navigation" mode.
1/15
Related flashcards
Related practice
Recommended videos
Basics of Graphing quiz #1
Basics of Graphing
10 Terms
Basics of Graphing
0. Review of College Algebra
5 problems
Topic
Patrick
Functions
0. Review of College Algebra
6 problems
Topic
Patrick
0. Review of College Algebra - Part 1 of 2
4 topics
9 problems
Chapter
Patrick
0. Review of College Algebra - Part 2 of 2
4 topics
8 problems
Chapter
Patrick
4:08
Graphing Intercepts
738
views
12
rank
2:16
Example 1
918
views
12
rank
5:10
Introduction to Graphs & the Coordinate System
1257
views
17
rank
Terms in this set (15)
Hide definitions
Rectangular Coordinate System
A two-dimensional grid formed by intersecting perpendicular number lines, used to plot locations with two values.
Cartesian Plane
A grid with horizontal and vertical axes, allowing representation of points with ordered pairs.
X Axis
The horizontal reference line in a two-dimensional grid, used for plotting the first value in an ordered pair.
Y Axis
The vertical reference line in a two-dimensional grid, used for plotting the second value in an ordered pair.
Origin
The central point where the horizontal and vertical axes intersect, represented by the pair 0, 0.
Ordered Pair
A set of two numbers in parentheses, indicating a specific location on a two-dimensional grid.
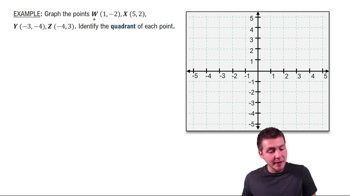
Quadrant
One of four regions created by the intersection of the axes, each with distinct sign combinations for values.
Two-Dimensional Plane
A flat surface defined by two perpendicular axes, allowing plotting of points with two values.
Linear Equation
A mathematical statement involving two variables whose graph forms a straight line on a grid.
Table
An organized arrangement of values used to systematically calculate and display pairs for graphing.
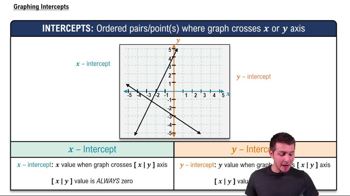
X-Intercept
A location where a graph crosses the horizontal axis, with the second value always zero.
Y-Intercept
A location where a graph crosses the vertical axis, with the first value always zero.
Solution Set
A collection of pairs that satisfy a mathematical statement, often visualized as points on a grid.
Graph
A visual representation of mathematical relationships, created by plotting points and connecting them.
Number Line
A one-dimensional reference used for plotting single values, forming the basis for axes in a grid.
 BackBack
 4:08
4:08