Textbook Question
Graph each function over a two-period interval.
y = 1 - cot x
816
views
 Verified step by step guidance
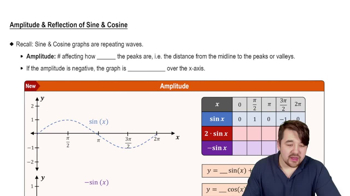
 5:05
5:05 5:33
5:33 6:31
6:31Graph each function over a two-period interval.
y = 1 - cot x
Each function graphed is of the form y = c + cos x, y = c + sin x, y = cos(x - d), or y = sin(x - d), where d is the least possible positive value. Determine an equation of the graph.
<IMAGE>
Graph each function over a two-period interval.
y= -1 + (1/2) cot (2x - 3π)
Graph each function over a two-period interval.
y = 1 + tan x
Graph each function over a two-period interval.
y = -1 + 2 tan x
For each function, give the amplitude, period, vertical translation, and phase shift, as applicable.
y = -¼ cos (½ x + π/2)