
Ch. 1 - Functions
Briggs - Calculus: Early Transcendentals 3rd Edition
Briggs3rd EditionCalculus: Early TranscendentalsISBN: 9780136847243Not the one you use?Change textbook
Chapter 1, Problem 66

Find a trigonometric function ff represented by the graph in the figure. <IMAGE>

Verified step by step guidance
1
Identify the key features of the trigonometric graph, such as amplitude, period, phase shift, and vertical shift. These features will help determine the specific trigonometric function.
Determine the amplitude by measuring the vertical distance from the midline of the graph to a peak or trough. The amplitude is the absolute value of this distance.
Calculate the period of the function by identifying the horizontal length of one complete cycle of the graph. This can be done by measuring the distance between two consecutive peaks or troughs.
Check for any phase shift by observing if the graph is shifted horizontally from the standard position of a basic trigonometric function like sine or cosine.
Look for any vertical shift by determining if the midline of the graph is above or below the x-axis. This will indicate if the function has been shifted up or down.

Verified video answer for a similar problem:

This video solution was recommended by our tutors as helpful for the problem above.
Video duration:
7m
Was this helpful?

Key Concepts

Here are the essential concepts you must grasp in order to answer the question correctly.

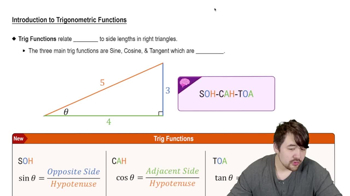
Trigonometric Functions

Trigonometric functions, such as sine, cosine, and tangent, relate angles to the ratios of sides in right triangles. They are periodic functions, meaning they repeat their values in regular intervals, which is crucial for analyzing wave-like behaviors in graphs. Understanding these functions is essential for interpreting the graph and identifying the specific function that matches its shape.
Recommended video:
6:04
Introduction to Trigonometric Functions

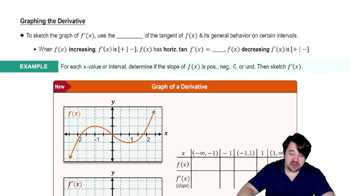
Graph Interpretation

Graph interpretation involves analyzing the visual representation of a function to extract information about its behavior, such as amplitude, period, and phase shift. For trigonometric functions, recognizing key features like peaks, troughs, and intercepts helps in determining the specific function that corresponds to the graph. This skill is vital for solving problems that require matching a function to its graphical representation.
Recommended video:
06:15
Graphing The Derivative

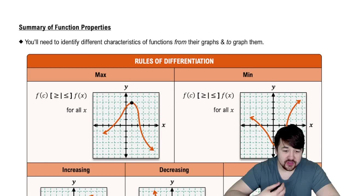
Function Representation

Function representation refers to expressing a mathematical relationship in various forms, such as equations, graphs, or tables. In the context of trigonometric functions, this includes writing the function in standard form, which may involve parameters like amplitude and frequency. Understanding how to convert between these representations is crucial for accurately identifying the function depicted in the graph.
Recommended video:
06:21
Properties of Functions