
Ch. 1 - Functions
Briggs - Calculus: Early Transcendentals 3rd Edition
Briggs3rd EditionCalculus: Early TranscendentalsISBN: 9780136847243Not the one you use?Change textbook
Chapter 1, Problem 77

In each exercise, a function and an interval of its independent variable are given. The endpoints of the interval are associated with points PP and QQ on the graph of the function.
a. Sketch a graph of the function and the secant line through PP and QQ.
b. Find the slope of the secant line in part (a), and interpret your answer in terms of an average rate of change over the interval. Include units in your answer.
After tt seconds, an object dropped from rest falls a distance d=16t2d=16t^2, where dd is measured in feet and 2t52\(\leq{t}\]\leq{5}\).

Verified step by step guidance
1
Identify the function given: d(t) = 16t^2, where d is the distance in feet and t is the time in seconds. The interval for t is [2, 5].
Sketch the graph of the function d(t) = 16t^2. This is a parabola opening upwards, and you should plot points for t = 2 and t = 5 to find the corresponding points P and Q on the graph.
Calculate the coordinates of points P and Q. For P, substitute t = 2 into the function to get d(2) = 16(2)^2 = 64, so P is (2, 64). For Q, substitute t = 5 into the function to get d(5) = 16(5)^2 = 400, so Q is (5, 400).
Find the slope of the secant line through points P and Q. The slope m is given by the formula m = (d(t2) - d(t1)) / (t2 - t1). Substitute the coordinates of P and Q: m = (400 - 64) / (5 - 2).
Interpret the slope of the secant line as the average rate of change of the distance with respect to time over the interval [2, 5]. The units of the slope are feet per second, indicating how fast the distance changes on average as time progresses from 2 to 5 seconds.

Verified video answer for a similar problem:

This video solution was recommended by our tutors as helpful for the problem above.
Video duration:
6m
Was this helpful?

Key Concepts

Here are the essential concepts you must grasp in order to answer the question correctly.

Secant Line

A secant line is a straight line that intersects a curve at two or more points. In calculus, it is often used to approximate the slope of the curve between those points. The slope of the secant line represents the average rate of change of the function over the interval defined by the two points. This concept is foundational for understanding the transition to the derivative, which represents the instantaneous rate of change.
Recommended video:
05:13
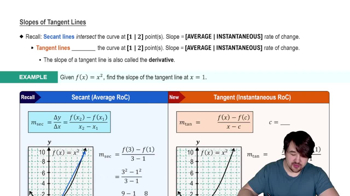
Slopes of Tangent Lines

Average Rate of Change

The average rate of change of a function over an interval is calculated as the change in the function's value divided by the change in the independent variable. Mathematically, it is expressed as (f(Q) - f(P)) / (Q - P), where P and Q are the endpoints of the interval. This concept is crucial for interpreting the behavior of functions over specific intervals and is a precursor to the concept of instantaneous rate of change, which is defined by the derivative.
Recommended video:
04:16
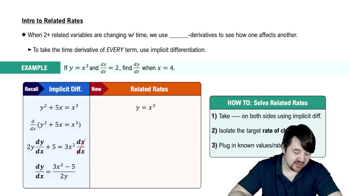
Intro To Related Rates

Graphing Functions

Graphing functions involves plotting points on a coordinate system to visually represent the relationship between the independent and dependent variables. Understanding how to sketch a graph is essential for visualizing the behavior of functions, including identifying key features such as intercepts, slopes, and curvature. This skill is particularly important when analyzing secant lines and their slopes, as it provides a visual context for the mathematical concepts being applied.
Recommended video:
5:53
Graph of Sine and Cosine Function