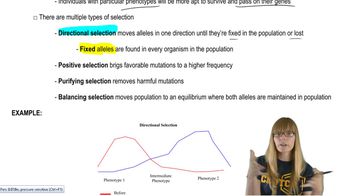
Pearson+ LogoPearson+ Logo
Ch. 20 - Population Genetics and Evolution at the Population, Species, and Molecular Levels
Sanders - Genetic Analysis: An Integrated Approach 3rd Edition
Sanders3rd EditionGenetic Analysis: An Integrated ApproachISBN: 9780135564172Not the one you use?Change textbook
Chapter 20, Problem 26c

Assume that the flower population described in the previous problem undergoes a different pattern of predation. Flower-color determination and the starting frequencies of C₁ and C₂ are as described above, but the new insects attack yellow and red flowers, not orange flowers. As a result of the predation pattern, the relative fitness values are C₁C₁ = 0.40, C₁C₂ = 1.0, and C₂C₂ = 0.80.
What are the equilibrium allele frequencies in the predation environment?

Verified step by step guidance
1
Step 1: Understand the problem. The goal is to calculate the equilibrium allele frequencies (C₁ and C₂) under the given predation environment. The relative fitness values for the genotypes are provided: C₁C₁ = 0.40, C₁C₂ = 1.0, and C₂C₂ = 0.80.
Step 2: Recall the concept of equilibrium allele frequencies. At equilibrium, the allele frequencies remain constant over generations because the forces of selection balance out. This involves using the fitness values and solving for the allele frequencies that satisfy the Hardy-Weinberg principle under selection.
Step 3: Write the equation for the mean fitness (w̄) of the population. The mean fitness is calculated as: w̄ = p²w₁₁ + 2pqw₁₂ + q²w₂₂, where p is the frequency of allele C₁, q is the frequency of allele C₂ (q = 1 - p), and w₁₁, w₁₂, and w₂₂ are the fitness values for C₁C₁, C₁C₂, and C₂C₂ respectively.
Step 4: Derive the change in allele frequency due to selection. Use the equation: Δp = p(1 - p)(w̄₁ - w̄₂)/w̄, where w̄₁ and w̄₂ are the average fitness contributions of alleles C₁ and C₂. At equilibrium, Δp = 0, which allows us to solve for the equilibrium frequencies.
Step 5: Solve for the equilibrium frequencies. Substitute the fitness values (w₁₁ = 0.40, w₁₂ = 1.0, w₂₂ = 0.80) into the equations derived in Steps 3 and 4. Use algebraic methods to find the values of p and q that satisfy the equilibrium condition. These values represent the equilibrium allele frequencies in the given predation environment.

Verified video answer for a similar problem:

This video solution was recommended by our tutors as helpful for the problem above.
Video duration:
2m
Was this helpful?

Key Concepts

Here are the essential concepts you must grasp in order to answer the question correctly.

Allele Frequency

Allele frequency refers to how often a particular allele appears in a population relative to other alleles for the same gene. It is a key measure in population genetics, indicating the genetic diversity and evolutionary potential of a population. Understanding allele frequencies is crucial for predicting how traits may change over generations, especially under selective pressures like predation.
Recommended video:
Guided course
03:03
New Alleles and Migration

Relative Fitness

Relative fitness is a measure of the reproductive success of a genotype compared to others in the population. It is expressed as a value that indicates how well a particular genotype can survive and reproduce in a given environment. In this scenario, the relative fitness values for different flower color genotypes help determine which alleles will increase or decrease in frequency due to predation.
Recommended video:
Guided course
05:54
Natural Selection

Hardy-Weinberg Equilibrium

Hardy-Weinberg equilibrium is a principle that describes the genetic variation in a population that is not evolving. It provides a baseline to compare actual allele frequencies against expected frequencies under certain conditions, such as no selection, mutation, migration, or genetic drift. In the context of this question, understanding how predation affects allele frequencies can help determine if the population is in equilibrium or undergoing evolutionary change.
Recommended video:
Guided course
13:04
Hardy Weinberg
Related Practice
Textbook Question

In a population of flowers growing in a meadow, C1 and C2 are autosomal codominant alleles that control flower color. The alleles are polymorphic in the population, with f (C1) = 0.80 and f (C2) = 0.20. Flowers that are C1C1 are yellow, orange flowers are C1C2, and C2C2 flowers are red. A storm blows a new species of hungry insects into the meadow, and they begin to eat yellow and orange flowers but not red flowers. The predation exerts strong natural selection on the flower population, resulting in relative fitness values of C1C1 = 0.30, C1C2 = 0.60, and C2C2 = 1.0.

What are the equilibrium frequencies of C1 and C2 if predation continues?

515
views
Textbook Question

Assume that the flower population described in the previous problem undergoes a different pattern of predation. Flower-color determination and the starting frequencies of C₁ and C₂ are as described above, but the new insects attack yellow and red flowers, not orange flowers. As a result of the predation pattern, the relative fitness values are C₁C₁ = 0.40, C₁C₂ = 1.0, and C₂C₂ = 0.80.

What are the allele frequencies after one generation of natural selection?

497
views
Textbook Question

Assume that the flower population described in the previous problem undergoes a different pattern of predation. Flower-color determination and the starting frequencies of C₁ and C₂ are as described above, but the new insects attack yellow and red flowers, not orange flowers. As a result of the predation pattern, the relative fitness values are C₁C₁ = 0.40, C₁C₂ = 1.0, and C₂C₂ = 0.80.

What are the genotype frequencies among the progeny of predation survivors?

452
views
Textbook Question

ABO blood type is examined in a Taiwanese population, and allele frequencies are determined. In the population, f (Iᴬ) = 0.30, f (Iᴮ) = 0.15, and f (i) = 0.55.f. Assuming Hardy–Weinberg conditions apply, what are the frequencies of genotypes, and what are the blood group frequencies in this population?

510
views
Textbook Question
A total of 1000 members of a Central American population are typed for the ABO blood group. In the sample, 421 have blood type A, 168 have blood type B, 336 have blood type O, and 75 have blood type AB. Use this information to determine the frequency of ABO blood group alleles in the sample.
1006
views
Textbook Question

A sample of 500 field mice contains 225 individuals that are D₁D₁, 175 that are D₁D₂, and 100 that are D₂D₂.

What are the frequencies of D₁ and D₂ in this sample?

574
views