Ch. 2 - Graphs of the Trigonometric Functions; Inverse Trigonometric Functions
Blitzer - Trigonometry 3rd Edition
Blitzer3rd EditionTrigonometryISBN: 9780137316601Not the one you use?Change textbook
Chapter 2, Problem 1

Graph one period of each function. y = 3 sin 2x

Verified step by step guidance
1
Identify the general form of the sine function: \(y = A \sin(Bx)\), where \(A\) is the amplitude and \(B\) affects the period.
Determine the amplitude \(A\) by looking at the coefficient in front of the sine function. Here, \(A = 3\), which means the graph will oscillate between \(3\) and \(-3\).
Calculate the period of the function using the formula \(\text{Period} = \frac{2\pi}{B}\). Since \(B = 2\), the period is \(\frac{2\pi}{2} = \pi\).
Set up the x-values for one period starting from \(0\) to \(\pi\). This means you will graph the function from \(x=0\) to \(x=\pi\).
Plot key points within one period: at \(x=0\), \(x=\frac{\pi}{4}\), \(x=\frac{\pi}{2}\), \(x=\frac{3\pi}{4}\), and \(x=\pi\), using the function \(y = 3 \sin(2x)\), then connect these points smoothly to form one complete sine wave.

Verified video answer for a similar problem:

This video solution was recommended by our tutors as helpful for the problem above.
Video duration:
5m
Was this helpful?

Key Concepts

Here are the essential concepts you must grasp in order to answer the question correctly.

Amplitude of a Sine Function

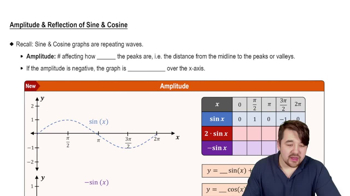
The amplitude is the maximum value the sine function reaches from its midline, determined by the coefficient before the sine term. For y = 3 sin 2x, the amplitude is 3, meaning the graph oscillates between -3 and 3.
Recommended video:
5:05
Amplitude and Reflection of Sine and Cosine

Period of a Sine Function

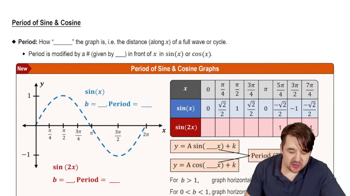
The period is the length of one complete cycle of the sine wave. It is calculated as (2π) divided by the coefficient of x inside the sine function. For y = 3 sin 2x, the period is π, so the graph completes one full wave from 0 to π.
Recommended video:
5:33
Period of Sine and Cosine Functions

Graphing One Period of a Sine Function

To graph one period, plot points starting at x = 0 and ending at x equal to the period, marking key points where the sine function reaches 0, maximum, and minimum values. For y = 3 sin 2x, plot from 0 to π, noting the amplitude and zero crossings.
Recommended video:
5:33
Period of Sine and Cosine Functions