
Textbook Question
21–42. Geometric series Evaluate each geometric series or state that it diverges.
41.∑ (k = 1 to ∞) 4 / 12ᵏ
42
views

 Verified step by step guidance
 8:22
8:22 8:22 8:22
21–42. Geometric series Evaluate each geometric series or state that it diverges.
41.∑ (k = 1 to ∞) 4 / 12ᵏ
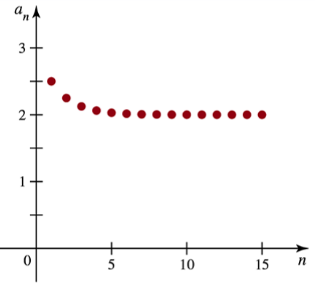
51–56. {Use of Tech} Recurrence relations Consider the following recurrence relations. Make a table with at least ten terms and determine a plausible limit of the sequence or state that the sequence diverges.
aₙ₊₁ = 4aₙ + 1 a₀ = 1
84–87. {Use of Tech} Sequences by recurrence relations
The following sequences, defined by a recurrence relation, are monotonic and bounded, and therefore converge by Theorem 10.5.
a.Examine the first three terms of the sequence to determine whether the sequence is nondecreasing or nonincreasing.
b.Use analytical methods to find the limit of the sequence.
aₙ₊₁ = 2aₙ(1 − aₙ);a₀ = 0.3
What comparison series would you use with the Limit Comparison Test to determine whether ∑ (k = 1 to ∞) (k² + k + 5) / (k³ + 3k + 1) converges?
11–86. Applying convergence tests Determine whether the following series converge. Justify your answers.
∑ (from k = 1 to ∞) k⁴ / (eᵏ⁵)
Growth rates of sequences
Use Theorem 10.6 to find the limit of the following sequences or state that they diverge.
{n¹⁰ / ln20n}