Textbook Question
Shifting and Scaling Graphs
Suppose the graph of g is given. Write equations for the graphs that are obtained from the graph of g by shifting, scaling, or reflecting, as indicated.
e. Stretch vertically by a factor of 5
352
views

 Verified step by step guidance
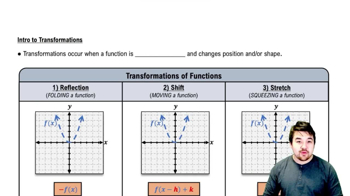
 5:25 5:25
 5:53
5:53Shifting and Scaling Graphs
Suppose the graph of g is given. Write equations for the graphs that are obtained from the graph of g by shifting, scaling, or reflecting, as indicated.
e. Stretch vertically by a factor of 5
Describe how each graph is obtained from the graph of 𝔂 = ƒ(x).
d. 𝔂 = ƒ(2x + 1)
Describe how each graph is obtained from the graph of 𝔂 = ƒ(x).
e. 𝔂 = ƒ( x ) - 4
3
Shifting and Scaling Graphs
Suppose the graph of g is given. Write equations for the graphs that are obtained from the graph of g by shifting, scaling, or reflecting, as indicated.
f. Compress horizontally by a factor of 5
For Exercises 51–54, solve for the angle θ, where 0 ≤ θ ≤ 2π.
cos 2θ + cos θ = 0
In Exercises 55–58, graph each function, not by plotting points, but by starting with the graph of one of the standard functions presented in Figures 1.15–1.17, and applying an appropriate transformation.
y = - √(1 + x/2)