Ch.12 - Parametric and Polar Curves
Briggs - Calculus: Early Transcendentals 3rd Edition
Briggs3rd EditionCalculus: Early TranscendentalsISBN: 9780136847243Not the one you use?Change textbook
Chapter 12, Problem 12.1.63

{Use of Tech} Implicit function graph Explain and carry out a method for graphing the curve x = 1 + cos² y − sin² y using parametric equations and a graphing utility.

Verified step by step guidance
1
Recognize that the given equation is an implicit relation between \( x \) and \( y \): \( x = 1 + \cos^{2} y - \sin^{2} y \). Our goal is to express both \( x \) and \( y \) as functions of a parameter to use parametric equations for graphing.
Use a trigonometric identity to simplify the expression for \( x \). Recall that \( \cos^{2} y - \sin^{2} y = \cos(2y) \). Substitute this into the equation to get \( x = 1 + \cos(2y) \).
Choose \( y \) as the parameter \( t \), so that \( y = t \). Then express \( x \) in terms of \( t \) as \( x = 1 + \cos(2t) \). This gives the parametric equations: \[ x(t) = 1 + \cos(2t), \quad y(t) = t. \]
Determine a suitable domain for the parameter \( t \) to capture the behavior of the curve. Since \( y = t \), choose an interval for \( t \) that covers the desired range of \( y \) values, for example \( t \in [-2\pi, 2\pi] \) to see multiple periods of the cosine function.
Use a graphing utility to plot the parametric curve defined by \( x(t) = 1 + \cos(2t) \) and \( y(t) = t \) over the chosen interval. This will produce the graph of the original implicit function.

Verified video answer for a similar problem:

This video solution was recommended by our tutors as helpful for the problem above.
Video duration:
2m
Was this helpful?

Key Concepts

Here are the essential concepts you must grasp in order to answer the question correctly.

Implicit Functions and Their Graphs

An implicit function defines a relationship between variables without explicitly solving for one variable in terms of another. Graphing such functions often requires rewriting or parameterizing the equation to visualize the curve, especially when direct expression is complex or impossible.
Recommended video:
05:14
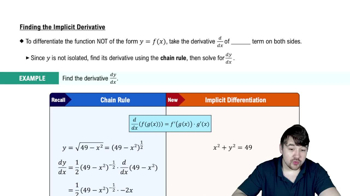
Finding The Implicit Derivative

Parametric Equations

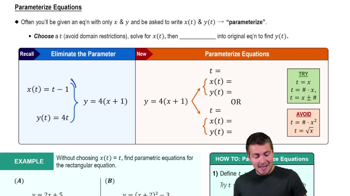
Parametric equations express both variables as functions of a third parameter, usually denoted t or θ. This method simplifies graphing by converting implicit or complex equations into a set of explicit formulas, allowing the use of graphing utilities to plot curves easily.
Recommended video:
Guided course
08:02
Parameterizing Equations

Use of Graphing Utilities

Graphing utilities, such as graphing calculators or software, enable visualization of curves by plotting parametric equations over a range of parameter values. They help in exploring the shape and behavior of implicit functions by automating calculations and rendering accurate graphs.
Recommended video:
06:15
Graphing The Derivative