In mathematics, parametric equations are a way to express two variables, typically \(x\) and \(y\), in terms of a third variable known as the parameter, usually denoted as \(t\). This means that instead of having a single equation like \(y = 2x - 3\), you will have two equations: \(x(t)\) and \(y(t)\). Understanding how to graph these equations is essential, as it allows for the representation of more complex relationships between the variables.
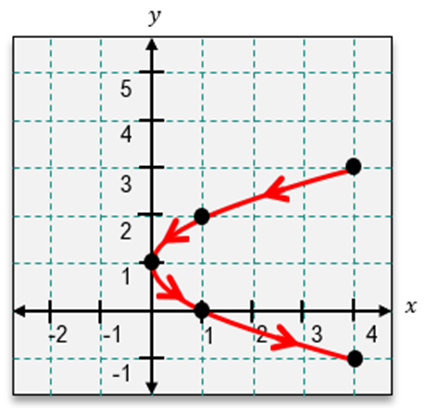
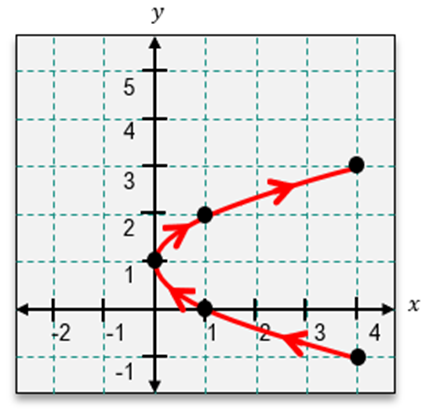
To graph parametric equations, the process is similar to graphing standard equations. You will create a table of values that includes three columns: one for the parameter \(t\), one for \(x\), and one for \(y\). The values of \(t\) can either be provided or chosen, and you will substitute these values into the equations to find the corresponding \(x\) and \(y\) values. For example, if you have the equations \(x(t) = t + 1\) and \(y(t) = 2t - 1\), you can calculate the points by plugging in values for \(t\). When \(t = 1\), \(x = 2\) and \(y = 1\); when \(t = 2\), \(x = 3\) and \(y = 3\); and so on.
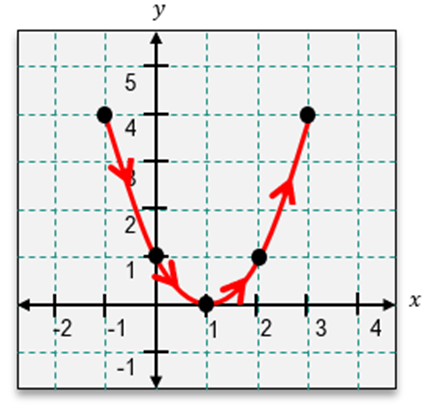
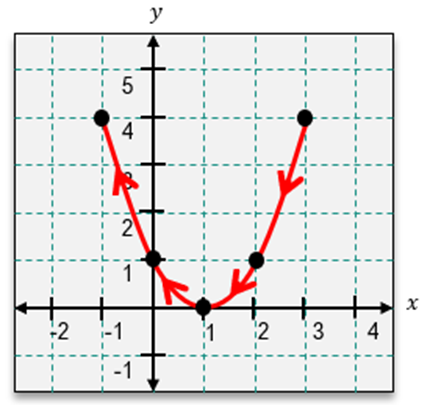
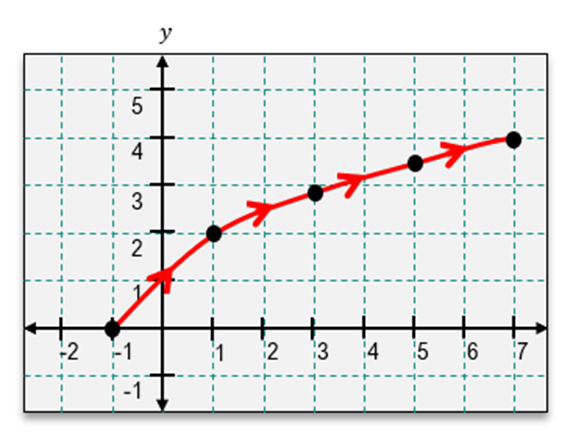
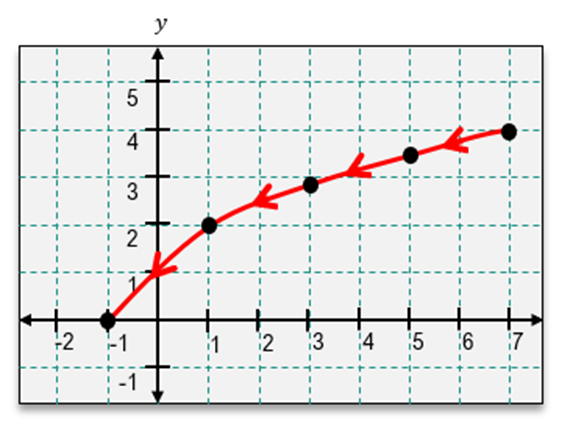
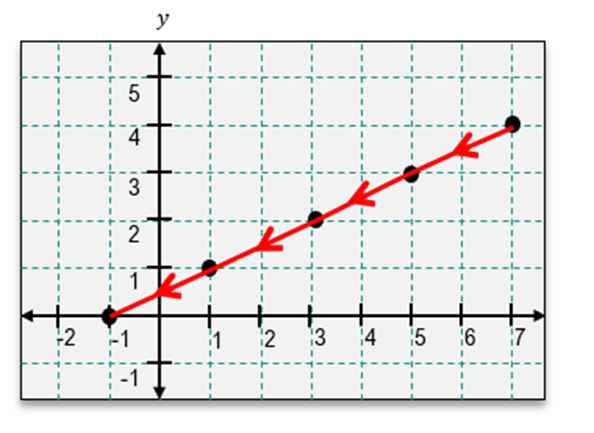
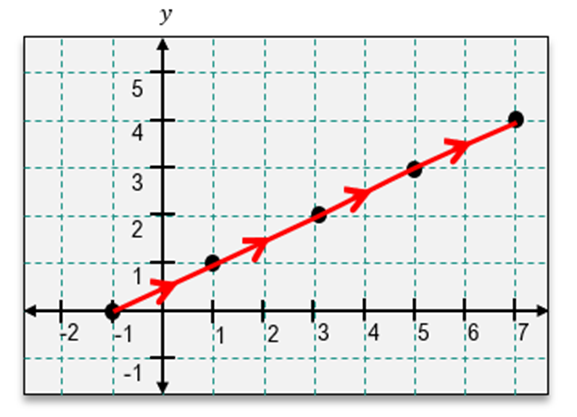
Once you have a set of points, you can plot them on a coordinate plane. It’s important to note that the graph of parametric equations is referred to as a plane curve, which can take various forms, including lines, parabolas, or more complex shapes. Unlike standard equations, parametric equations do not have a defined axis for \(t\), so it is common to indicate the corresponding \(t\) values next to their coordinates. This helps clarify the direction of the graph, as the orientation of the curve is determined by the increasing values of \(t\).
To indicate the direction of the graph, arrows are often drawn along the curve, showing how the graph progresses as \(t\) increases. This is a crucial aspect of parametric equations, as it provides insight into the behavior of the graph over time or along the parameter's range.
In summary, parametric equations allow for a flexible representation of relationships between variables, and understanding how to graph them involves creating a table of values, plotting points, and indicating the direction of the curve. This foundational knowledge is essential for exploring more advanced topics in mathematics.