Ch. 13 - Mass Spectrometry; Infrared Spectroscopy; UV/Vis Spectroscopy
Bruice - Organic Chemistry 8th Edition
Bruice8th EditionOrganic ChemistryISBN: 9780135213711Not the one you use?Change textbook
Chapter 13, Problem 52

A compound gives a mass spectrum with essentially only three peaks at m/z = 77 (40%), 112 (100%), and 114 (33%). Identify the compound.

Verified step by step guidance
1
Analyze the mass spectrum data: The peaks at m/z = 77, 112, and 114 represent the molecular ion and possible fragments. The relative intensities (40%, 100%, and 33%) provide clues about the isotopic composition and structure of the compound.
Focus on the molecular ion peaks at m/z = 112 and 114. The presence of two peaks with a 2 m/z difference and a relative intensity ratio of approximately 3:1 suggests the presence of a chlorine atom. Chlorine has two isotopes, 35Cl and 37Cl, with a natural abundance ratio of about 3:1.
Deduce the molecular formula: The molecular ion peak at m/z = 112 corresponds to the compound containing 35Cl, while the peak at m/z = 114 corresponds to the compound containing 37Cl. This indicates the compound likely contains one chlorine atom.
Examine the fragment peak at m/z = 77: This peak is likely a stable aromatic fragment, such as a phenyl group (C₆H₅⁺), which is common in compounds containing benzene rings.
Combine the information: The compound is likely a chlorobenzene derivative, specifically chlorobenzene (C₆H₅Cl), as it matches the observed mass spectrum with a molecular ion at m/z = 112 (C₆H₅⁻³⁵Cl) and 114 (C₆H₅⁻³⁷Cl), and a fragment peak at m/z = 77 (C₆H₅⁺).

Verified video answer for a similar problem:

This video solution was recommended by our tutors as helpful for the problem above.
Video duration:
4m

Key Concepts

Here are the essential concepts you must grasp in order to answer the question correctly.

Mass Spectrometry

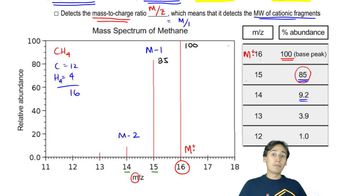
Mass spectrometry is an analytical technique used to measure the mass-to-charge ratio of ions. It provides information about the molecular weight and structure of compounds by generating a mass spectrum, which displays the abundance of ions at various mass-to-charge (m/z) values. The peaks in the spectrum correspond to different ions, allowing chemists to deduce the molecular composition of the sample.
Recommended video:
01:25
How to Read a Mass Spectrum

Isotopic Patterns

Isotopic patterns arise from the presence of isotopes in elements, which can lead to multiple peaks in a mass spectrum. For example, carbon has isotopes like 12C and 13C, which can create peaks at different m/z values. Understanding these patterns helps in identifying the molecular formula of a compound, as the relative intensities of the peaks can indicate the number of each type of atom present.
Recommended video:
08:06
Common Splitting Patterns

Molecular Ion Peak

The molecular ion peak in a mass spectrum represents the intact molecule of the compound being analyzed, typically observed at the highest m/z value. This peak is crucial for determining the molecular weight of the compound. In the given spectrum, the peak at m/z = 112 likely corresponds to the molecular ion, while the other peaks can indicate fragment ions or isotopes, aiding in the identification of the compound.
Recommended video:
Guided course
3:39
Metal Ion Catalysis Concept 1