Ch. 4 - Graphs of the Circular Functions
Lial - Trigonometry 12th Edition
Lial12th EditionTrigonometryISBN: 9780136552161Not the one you use?Change textbook
Chapter 5, Problem 51

Graph each function over a two-period interval. See Example 4.
y = -3 + 2 sin x

Verified step by step guidance
1
Identify the given function: \(y = -3 + 2 \sin x\). This is a sinusoidal function with a vertical shift and amplitude change.
Determine the amplitude of the sine function, which is the coefficient in front of \(\sin x\). Here, the amplitude is \(2\), meaning the sine wave oscillates \(2\) units above and below its midline.
Find the vertical shift, which is the constant term added to the sine function. In this case, the midline of the graph is shifted down by \(3\) units, so the midline is at \(y = -3\).
Since the function is \(\sin x\), the period is the standard period of sine, which is \(2\pi\). For a two-period interval, you will graph the function from \(x = 0\) to \(x = 4\pi\).
Plot key points for one period of \(\sin x\) (at \(0\), \(\frac{\pi}{2}\), \(\pi\), \(\frac{3\pi}{2}\), and \(2\pi\)), apply the amplitude and vertical shift to these points, then extend the pattern to cover two periods from \(0\) to \(4\pi\).

Verified video answer for a similar problem:

This video solution was recommended by our tutors as helpful for the problem above.
Was this helpful?

Key Concepts

Here are the essential concepts you must grasp in order to answer the question correctly.

Sine Function and Its Graph

The sine function, sin(x), is a periodic wave oscillating between -1 and 1 with a period of 2π. Its graph is smooth and continuous, repeating every 2π units along the x-axis. Understanding the basic shape and properties of sin(x) is essential for graphing transformations.
Recommended video:
5:53
Graph of Sine and Cosine Function

Amplitude and Vertical Shift

Amplitude refers to the height of the wave from its midline, determined by the coefficient multiplying sin(x). In y = -3 + 2 sin x, the amplitude is 2, meaning the wave oscillates 2 units above and below the midline. The vertical shift, here -3, moves the entire graph down by 3 units, changing the midline from y=0 to y=-3.
Recommended video:
6:31
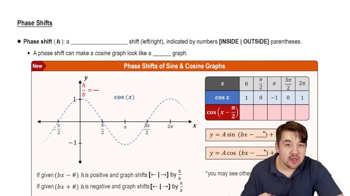
Phase Shifts

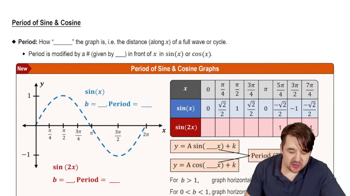
Period of the Function

The period is the length of one complete cycle of the sine wave, typically 2π for sin(x). Since the question asks for a two-period interval, the graph should be plotted over an interval of length 4π. Recognizing the period helps in correctly setting the x-axis range for the graph.
Recommended video:
5:33
Period of Sine and Cosine Functions