Ch. 2 - Graphs of the Trigonometric Functions; Inverse Trigonometric Functions
Blitzer - Trigonometry 3rd Edition
Blitzer3rd EditionTrigonometryISBN: 9780137316601Not the one you use?Change textbook
Chapter 2, Problem 62

In Exercises 61–66, use the method of adding y-coordinates to graph each function for 0 ≤ x ≤ 2π. y = 3 cos x + sin x

Verified step by step guidance
1
Identify the given function: \(y = 3 \cos x + \sin x\). We want to graph this function for \(0 \leq x \leq 2\pi\) by adding the \(y\)-coordinates of the individual trigonometric functions \(3 \cos x\) and \(\sin x\).
Create a table of values for \(x\) at key points within the interval \([0, 2\pi]\), such as \(0\), \(\frac{\pi}{2}\), \(\pi\), \(\frac{3\pi}{2}\), and \(2\pi\). For each \(x\), calculate \(3 \cos x\) and \(\sin x\) separately.
For each \(x\) value, add the corresponding \(y\)-coordinates: \(y = 3 \cos x + \sin x\). This means summing the values found for \(3 \cos x\) and \(\sin x\) at each \(x\).
Plot the points \((x, y)\) on the coordinate plane using the summed \(y\)-values from the previous step. This will give you points on the graph of the function \(y = 3 \cos x + \sin x\).
Connect the plotted points smoothly, keeping in mind the periodic and wave-like nature of sine and cosine functions, to complete the graph over the interval \(0 \leq x \leq 2\pi\).

Verified video answer for a similar problem:

This video solution was recommended by our tutors as helpful for the problem above.
Video duration:
8m
Was this helpful?

Key Concepts

Here are the essential concepts you must grasp in order to answer the question correctly.

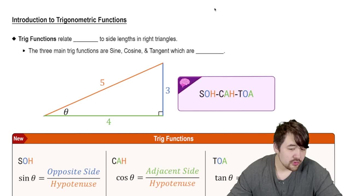
Graphing Trigonometric Functions

Graphing trigonometric functions involves plotting points based on their values at various x-coordinates, typically within one period such as 0 to 2π. Understanding the shape and behavior of sine and cosine functions helps in visualizing their graphs and how they combine.
Recommended video:
6:04
Introduction to Trigonometric Functions

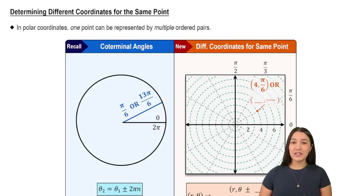
Superposition of Functions (Adding y-coordinates)

When combining functions like y = 3 cos x + sin x, the graph is formed by adding the y-values of each function at corresponding x-values. This method, called superposition, helps in constructing the resultant graph by pointwise addition of the individual function values.
Recommended video:
6:02
Determining Different Coordinates for the Same Point

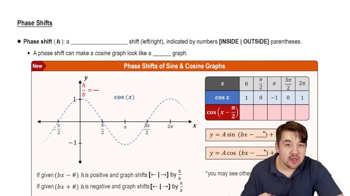
Amplitude and Phase Shift in Combined Trigonometric Functions

The combination y = 3 cos x + sin x can be rewritten as a single sinusoidal function with a specific amplitude and phase shift. Understanding how to find this equivalent form helps in analyzing the maximum and minimum values and the horizontal shift of the graph.
Recommended video:
6:31
Phase Shifts