Ch. 2 - Limits
Briggs - Calculus: Early Transcendentals 3rd Edition
Briggs3rd EditionCalculus: Early TranscendentalsISBN: 9780136847243Not the one you use?Change textbook
Chapter 2, Problem 33d

Determine whether the following statements are true and give an explanation or counterexample.


d. limx0x{\(\displaystyle\]\lim\)_{x\(\to\)0}}\(\sqrt{x}\) . (Hint: Graph y=√x)

Verified step by step guidance
1
Consider the function \( y = \sqrt{x} \) and its behavior as \( x \to 0 \).
Note that the square root function \( \sqrt{x} \) is only defined for \( x \geq 0 \).
As \( x \to 0^+ \) (approaching 0 from the right), \( \sqrt{x} \to \sqrt{0} = 0 \).
Since \( \sqrt{x} \) is not defined for \( x < 0 \), the limit from the left does not exist.
Therefore, the limit \( \lim_{x \to 0} \sqrt{x} \) does not exist because it is only defined from the right.

Verified video answer for a similar problem:

This video solution was recommended by our tutors as helpful for the problem above.
Video duration:
1m
Was this helpful?

Key Concepts

Here are the essential concepts you must grasp in order to answer the question correctly.

Limits

A limit is a fundamental concept in calculus that describes the behavior of a function as its input approaches a certain value. It helps in understanding how functions behave near points of interest, including points where they may not be defined. For example, the limit of √x as x approaches 0 examines the value that √x approaches as x gets closer to 0.
Recommended video:
05:50
One-Sided Limits

Square Root Function

The square root function, denoted as √x, is defined for non-negative values of x and returns the non-negative value whose square is x. This function is continuous and increases as x increases. Understanding its graph is crucial for analyzing limits, especially as it approaches 0, where the function's behavior can be visually interpreted.
Recommended video:
7:24
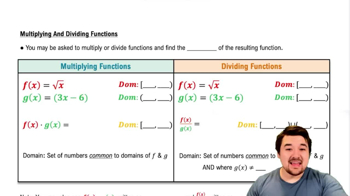
Multiplying & Dividing Functions

Graphical Interpretation

Graphical interpretation involves analyzing the visual representation of a function to understand its behavior. For the function y = √x, the graph is a curve that starts at the origin (0,0) and rises to the right. By examining this graph, one can intuitively grasp how the function behaves as x approaches 0, which aids in determining the limit.
Recommended video:
05:02
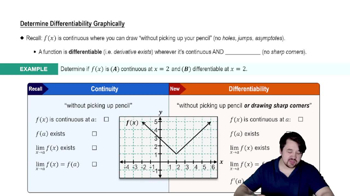
Determining Differentiability Graphically