
Ch. 3 - Derivatives
Hass - Thomas' Calculus 15th Edition
Hass15th EditionThomas' CalculusISBN: 9780137616077Not the one you use?Change textbook
Chapter 3, Problem 3.4.33d

Analyzing Motion Using Graphs


[Technology Exercise] Exercises 31–34 give the position function s = f(t) of an object moving along the s-axis as a function of time t. Graph f together with the velocity function v(t) = ds/dt = f'(t) and the acceleration function a(t) = d²s/dt² = f''(t). Comment on the object’s behavior in relation to the signs and values of v and a. Include in your commentary such topics as the following:


d. When does it speed up and slow down?


s = t³ - 6t² + 7t, 0 ≤ t ≤ 4

Verified step by step guidance
1
Step 1: Identify the position function s(t) = t³ - 6t² + 7t. This function describes the position of the object along the s-axis as a function of time t.
Step 2: Find the velocity function v(t) by differentiating the position function s(t) with respect to time t. This gives v(t) = ds/dt = f'(t) = 3t² - 12t + 7.
Step 3: Find the acceleration function a(t) by differentiating the velocity function v(t) with respect to time t. This gives a(t) = dv/dt = f''(t) = 6t - 12.
Step 4: Analyze the signs of v(t) and a(t) to determine when the object speeds up or slows down. The object speeds up when v(t) and a(t) have the same sign and slows down when they have opposite signs.
Step 5: Graph the functions s(t), v(t), and a(t) over the interval 0 ≤ t ≤ 4. Use the graphs to visually confirm the intervals where the object speeds up or slows down based on the behavior of v(t) and a(t).

Verified video answer for a similar problem:

This video solution was recommended by our tutors as helpful for the problem above.
Video duration:
4m
Was this helpful?

Key Concepts

Here are the essential concepts you must grasp in order to answer the question correctly.

Position, Velocity, and Acceleration

In calculus, the position function s(t) describes the location of an object over time. The velocity function v(t) is the first derivative of the position function, representing the rate of change of position, or speed, with direction. Acceleration a(t) is the second derivative of the position function, indicating the rate of change of velocity. Understanding these relationships is crucial for analyzing motion.
Recommended video:
08:14
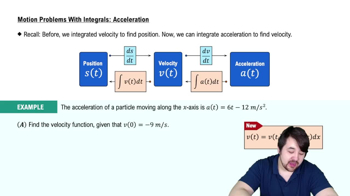
Using The Acceleration Function

Graphical Analysis of Derivatives

Graphing the position, velocity, and acceleration functions helps visualize how an object's motion changes over time. The slope of the position graph at any point gives the velocity, while the slope of the velocity graph gives the acceleration. Observing these graphs allows us to determine when the object is speeding up or slowing down based on the signs and magnitudes of v(t) and a(t).
Recommended video:
01:47
Graphical Applications of Exponential & Logarithmic Derivatives: Example 8

Interpreting Signs of Velocity and Acceleration

The signs of velocity and acceleration are key to understanding an object's motion. When both velocity and acceleration have the same sign, the object speeds up. Conversely, when they have opposite signs, the object slows down. Analyzing these signs in the context of the given functions helps predict and explain the object's behavior over time.
Recommended video:
06:15
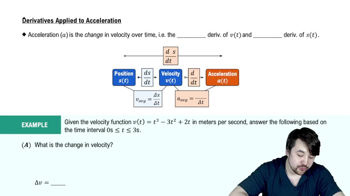
Derivatives Applied To Acceleration