Ch. 2 - Graphs and Functions
Lial - College Algebra 13th Edition
Lial13th EditionCollege AlgebraISBN: 9780136881063Not the one you use?Change textbook
Chapter 3, Problem 33c

Use the graph to evaluate each expression. See Example 3(a).
(ƒg)(0)
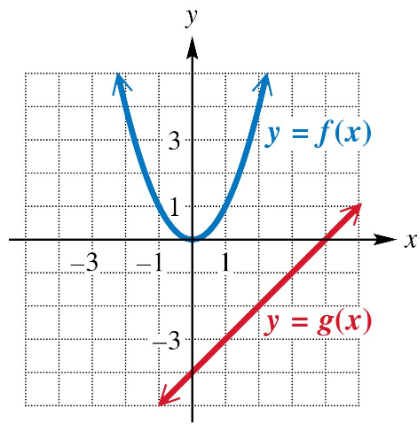
Graph showing two functions: a blue parabola y = f(x) opening upward and a red line y = g(x) with positive slope.

Verified step by step guidance
1
Understand that (ƒg)(0) means the composition of functions ƒ and g evaluated at 0, which is written as ƒ(g(0)).
First, find the value of g(0) by locating x = 0 on the g(x) graph (blue line) and reading the corresponding y-value.
Next, take the value found for g(0) and use it as the input for the function ƒ. This means you will find ƒ(g(0)) by locating x = g(0) on the ƒ(x) graph (red curve) and reading the corresponding y-value.
Write the expression for the composition: (ƒg)(0) = ƒ(g(0)) and substitute the values you found from the graph.
The final step is to interpret the y-value from the ƒ graph at x = g(0) as the result of (ƒg)(0).

Verified video answer for a similar problem:

This video solution was recommended by our tutors as helpful for the problem above.
Video duration:
3m
Was this helpful?

Key Concepts

Here are the essential concepts you must grasp in order to answer the question correctly.

Function Composition

Function composition involves applying one function to the result of another, denoted as (f∘g)(x) = f(g(x)). To evaluate (f∘g)(0), first find g(0), then substitute that value into f. This process combines two functions into a single operation.
Recommended video:
4:56
Function Composition

Reading Values from a Graph

To evaluate functions using a graph, locate the input value on the x-axis and find the corresponding y-value on the function's curve. This y-value represents the function's output for that input. Accurate reading is essential for correct evaluation.
Recommended video:
Guided course
05:10
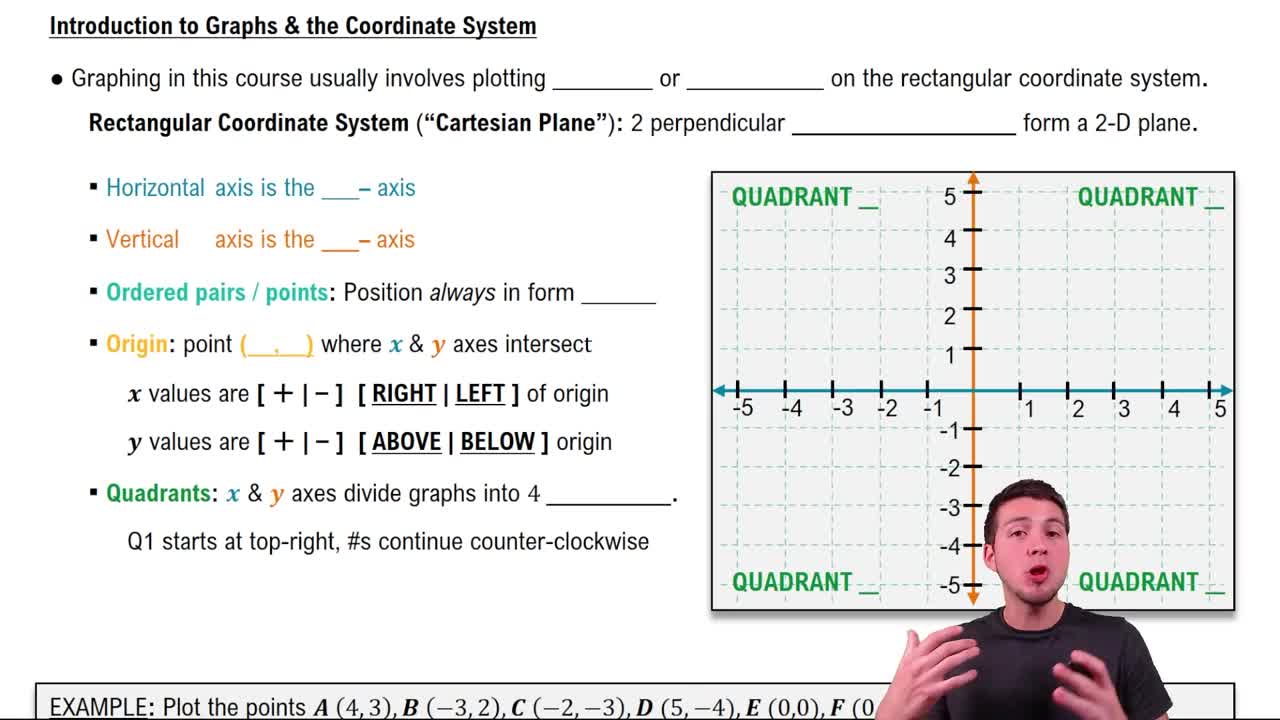
Graphs & the Rectangular Coordinate System

Understanding Quadratic and Linear Functions

The graph shows f(x) as a quadratic function (parabola) and g(x) as a linear function (straight line). Recognizing their shapes helps in interpreting values and behavior, such as f(x) having a minimum point and g(x) increasing steadily.
Recommended video:
06:04
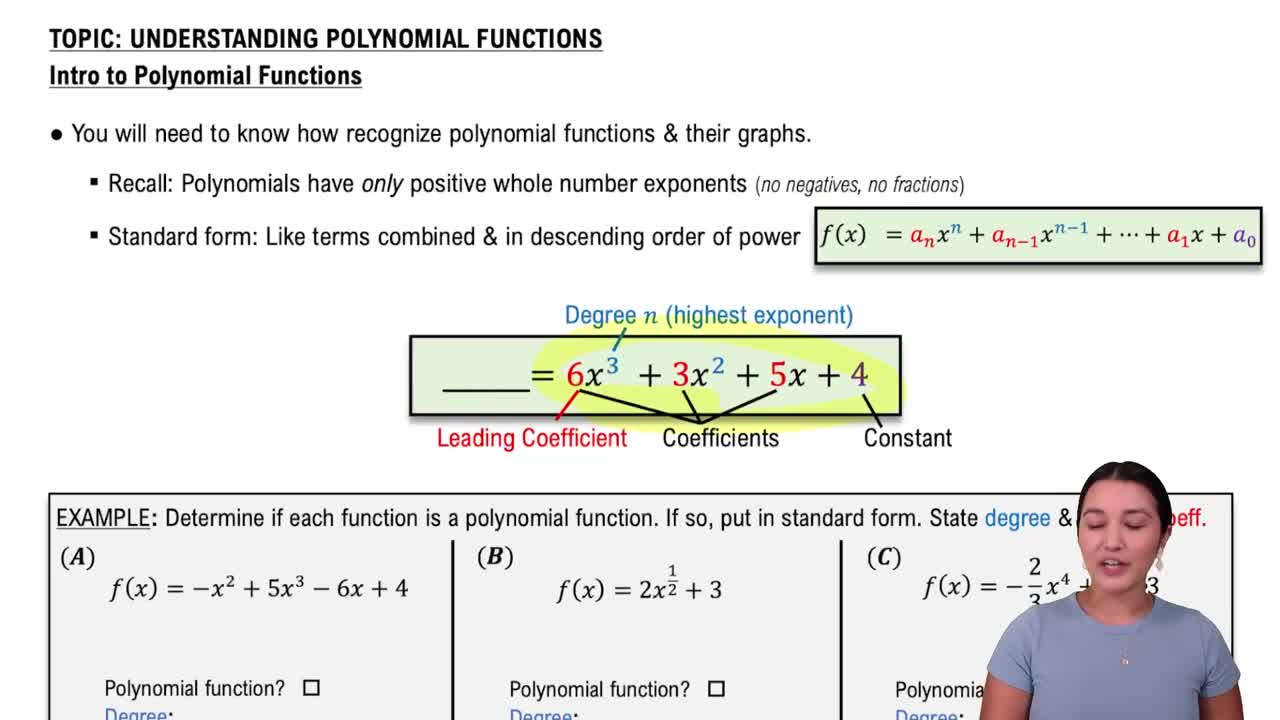
Introduction to Polynomial Functions